Nordstrom 2005 Annual Report Download - page 55
Download and view the complete annual report
Please find page 55 of the 2005 Nordstrom annual report below. You can navigate through the pages in the report by either clicking on the pages listed below, or by using the keyword search tool below to find specific information within the annual report.-
 1
1 -
2
-
3
-
4
-
5
-
6
-
7
-
8
-
9
-
10
-
11
-
12
-
13
-
14
-
15
-
16
-
17
-
18
-
19
-
20
-
21
-
22
-
23
-
24
-
25
-
26
-
27
-
28
-
29
-
30
-
31
-
32
-
33
-
34
-
35
-
36
-
37
-
38
-
39
-
40
-
41
-
42
-
43
-
44
-
 45
45 -
 46
46 -
 47
47 -
 48
48 -
 49
49 -
 50
50 -
 51
51 -
 52
52 -
 53
53 -
 54
54 -
 55
55 -
 56
56 -
 57
57 -
 58
58 -
 59
59 -
 60
60 -
 61
61 -
 62
62 -
 63
63 -
 64
64 -
 65
65 -
66
-
67
-
68
-
69
-
70
-
71
-
72
 |
 |

Nordstrom, Inc. and subsidiaries 47
Nordstrom, Inc.
Notes to Consolidated Financial Statements
Amounts in thousands except per share amounts
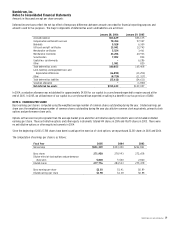
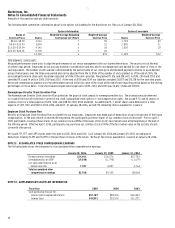
NOTE 16: SELF INSURANCE
We retain a portion of the risk for certain losses related to health and welfare, workers’ compensation and general liability claims. Liabilities
associated with these losses include estimates of both losses reported and losses incurred but not yet reported. We estimate our ultimate cost
based on analysis of historical data and independent actuarial estimates.
• Workers’ Compensation – We have a deductible per claim of $1,000 or less and no policy limits. Our workers’ compensation reserve was $55,226
and $64,446 at the end of 2005 and 2004 and our expense was $12,804, $29,263, and $33,782 in 2005, 2004, and 2003.
• General Liability – We have a deductible per claim of $1,000 or less and a policy limit up to $150,000. Our general liability insurance reserve was
$10,954 and $9,872 at the end of 2005 and 2004.
• Health and Welfare – We are self insured for our health and welfare coverage and do not have stop-loss coverage. Participants contribute to the
cost of their coverage and are subject to certain plan limits and deductibles. Our health and welfare reserve was $12,100 and $10,545 at the end of
2005 and 2004.
NOTE 17: COMMITMENTS AND CONTINGENT LIABILITIES
We are involved in routine claims, proceedings, and litigation arising from the normal course of our business. We do not believe any such claim,
proceeding or litigation, either alone or in aggregate, will have a material impact on our results of operations, financial position, or liquidity.
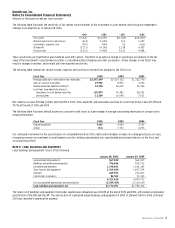
We are routinely audited for tax compliance by the federal, state, local and foreign jurisdictions in which we operate. The audits generally cover
several years and issues raised in an audit can impact other years that are available to be audited. While it is often difficult to predict whether we
will prevail, we believe that our tax reserves reflect the probable outcome of known tax contingencies. We periodically reassess the amount of such
reserves in light of changing facts and circumstances and adjust reserve balances as necessary. We have accrued $17,100 for anticipated tax and
interest to be paid for our exposure items. Our income tax returns for 2002 through 2004 are currently under examination by the IRS.
Our estimated total purchase obligations, capital expenditure contractual commitments and inventory purchase orders were $1,469,921 as of
January 28, 2006.
In connection with the purchase of foreign merchandise, we have outstanding import letters of credit totaling $19,485 and standby letters of credit
totaling $11,184 as of January 28, 2006.
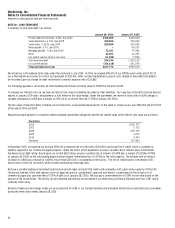
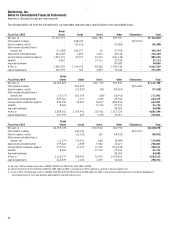
NOTE 18: SELECTED QUARTERLY DATA (UNAUDITED)
Fiscal Year 2005 1st Quarter 2nd Quarter 3rd Quarter 4th Quarter Total
Net sales $1,654,474 $2,106,438 $1,666,130 $2,295,818 $7,722,860
Same-store sales
percentage change 6.2% 6.2% 5.9% 5.8% 6.0%
Gross profit 608,309 758,923 607,678 859,927 2,834,837
Earnings before income taxes 172,980 241,793 163,012 307,440 885,225
Net earnings 104,538 148,918 107,453 190,430 551,339
Net earnings as a percentage of
net sales 6.3% 7.1% 6.4% 8.3% 7.1%
Basic earnings per share $0.38 $0.54 $0.40 $0.71 $2.03
Diluted earnings per share $0.38 $0.53 $0.39 $0.69 $1.98
Fiscal Year 2004 1st Quarter 2nd Quarter 3rd Quarter 4th Quarter Total
Net sales $1,535,490 $1,953,480 $1,542,075 $2,100,343 $7,131,388
Same-store sales
percentage change 13.2% 6.8% 8.1% 7.2% 8.5%
Gross profit 562,558 682,588 557,167 769,687 2,572,000
Earnings before income taxes 112,627 175,266 122,913 236,475 647,281
Net earnings 68,727 106,915 77,828 139,980 393,450
Net earnings as a percentage of
net sales 4.5% 5.5% 5.0% 6.7% 5.5%
Basic earnings per share $0.25 $0.38 $0.28 $0.51 $1.41
Diluted earnings per share $0.24 $0.37 $0.27 $0.50 $1.38