Nordstrom 2005 Annual Report Download - page 27
Download and view the complete annual report
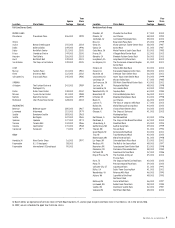
Please find page 27 of the 2005 Nordstrom annual report below. You can navigate through the pages in the report by either clicking on the pages listed below, or by using the keyword search tool below to find specific information within the annual report.-
 1
1 -
2
-
3
-
4
-
5
-
6
-
7
-
8
-
9
-
10
-
11
-
12
-
13
-
14
-
15
-
16
-
 17
17 -
 18
18 -
 19
19 -
 20
20 -
 21
21 -
 22
22 -
 23
23 -
 24
24 -
 25
25 -
 26
26 -
 27
27 -
 28
28 -
 29
29 -
 30
30 -
 31
31 -
 32
32 -
 33
33 -
 34
34 -
 35
35 -
 36
36 -
 37
37 -
38
-
39
-
40
-
41
-
42
-
43
-
44
-
45
-
46
-
47
-
48
-
49
-
50
-
51
-
52
-
53
-
54
-
55
-
56
-
57
-
58
-
59
-
60
-
61
-
62
-
63
-
64
-
65
-
66
-
67
-
68
-
69
-
70
-
71
-
72
 |
 |

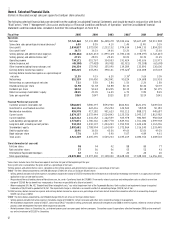
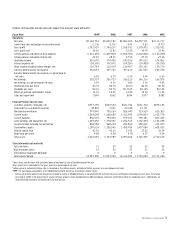
Nordstrom, Inc. and subsidiaries 19
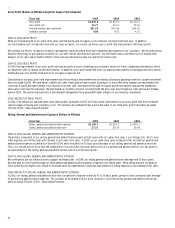
Operating Activities
2005 VS 2004 OPERATING ACTIVITIES
Net cash flow from operating activities increased from $606.3 million to $776.2 million, an increase of $169.9 million primarily due to the growth
in our net earnings. We continue to see growth in our co-branded VISA credit card program, and as a result we have increased the capital we
allocate to fund this program. Under our co-branded VISA program, we earn interchange and finance charge income and we offer card holders
merchandise certificates, which can be redeemed in our stores, similar to a gift certificate. Our operating cash flows have been sufficient over the
past three years to support the annual growth of this program, and we expect additional growth in 2006 also will be funded from our operations.
A key tool that we use to manage our inventory is our perpetual inventory system. In 2005, we reduced our average inventory per square foot
by 2.3%. We use our perpetual inventory system to identify sales trends quickly, so we can enhance additional sales opportunities and increase
inventory turnover.
In the course of negotiating for store locations, some developers offer up-front cash payments to defray our capital expenditures in exchange for
our commitment to operate a store in their development. In 2005, we received $49.5 million of these incentives, which is a $29.6 million increase
over 2004. Property incentive receipts vary year to year, depending on the number of our store openings and remodels and the arrangements we
negotiate with developers.
2004 VS 2003 OPERATING ACTIVITIES
In 2004, net cash flow from operating activities increased to $606.3 million, a $7.1 million increase. Higher net earnings was offset by our merchandise
purchase and payment flow changes in 2004 as compared to 2003 and the timing of income tax payments. Toward the end of 2003 and into 2004,
we achieved a more even flow of merchandise purchases in relation to our sales trends. Our 2004 inventory turns have improved over the prior
year; the payables leverage we achieved in 2004 is consistent with our merchandise purchase plan. Income tax payments have increased in 2004
as a result of our earnings growth.
2006 FORECAST FOR OPERATING ACTIVITIES
In 2006, cash flows provided by operating activities are expected to increase slightly as a result of increased net earnings.
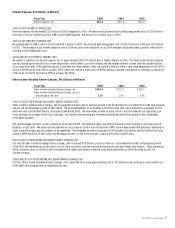
Investing Activities
In the past three years, we have had two principal types of investing activities: capital expenditures and short-term investments.
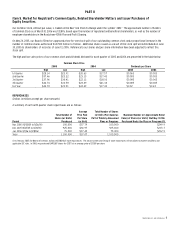
CAPITAL EXPENDITURES
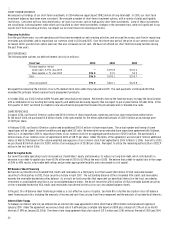
The changes in the level of our capital expenditures from year to year partially correlate to the number of stores opened in each year:
Fiscal Year 2
2
005 2004 2003
Capital expenditures (in millions) $271.7 $246.9 $258.3
Stores opened:
Full-Line 4 2 4
Rack — —
2
In 2005, we opened four Full-Line stores: at Phipps Plaza in Atlanta, Georgia; at The Shops at La Cantera in San Antonio, Texas; at the Irvine Spectrum
Center in Irvine, California; and at the NorthPark Center in Dallas, Texas. Gross square footage for the year increased approximately 3.5%, from
19,397,000 to 20,070,000. In 2005, 40% of our capital expenditures was for new stores and 30% was for remodels. In addition, 15% of our capital
expenditures was for information technology and 15% for other routine projects.
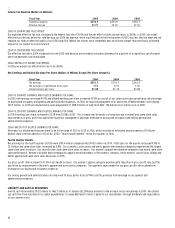
Our capital expenditures over the last three years totaled $776.8 million. These capital expenditures were offset by property incentives of $115.3
million. With these capital expenditures, we added stores, enhanced existing facilities and improved our information systems. More than 1.6 million
square feet of retail store space have been added during this period, representing an increase of 9% since January 31, 2003.
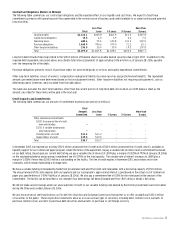
We expect that our capital expenditures will be $1.5 billion over the next three years, with $319 million planned for 2006. These future capital
expenditures are expected to be offset partially by property incentives of $230 million. We plan to use 50% of this investment to build new stores,
25% on remodels, 10% on information technology and 15% for smaller, store-related improvements. Compared to the previous three years, capital
expenditures will increase 94%, with increased spending allocated to new stores. The estimated capital project spending does not include potential
investments in new stores resulting from the current industry consolidation. We believe we have the capacity to address additional capital
investments should opportunities arise.
As of January 28, 2006, we were contractually committed to spend $567.5 million for constructing new stores, remodeling existing stores, and other
capital projects.