Nordstrom 2005 Annual Report Download - page 49
Download and view the complete annual report
Please find page 49 of the 2005 Nordstrom annual report below. You can navigate through the pages in the report by either clicking on the pages listed below, or by using the keyword search tool below to find specific information within the annual report.-
 1
1 -
2
-
3
-
4
-
5
-
6
-
7
-
8
-
9
-
10
-
11
-
12
-
13
-
14
-
15
-
16
-
17
-
18
-
19
-
20
-
21
-
22
-
23
-
24
-
25
-
26
-
27
-
28
-
29
-
30
-
31
-
32
-
33
-
34
-
35
-
36
-
37
-
38
-
 39
39 -
 40
40 -
 41
41 -
 42
42 -
 43
43 -
 44
44 -
 45
45 -
 46
46 -
 47
47 -
 48
48 -
 49
49 -
 50
50 -
 51
51 -
 52
52 -
 53
53 -
 54
54 -
 55
55 -
 56
56 -
 57
57 -
 58
58 -
 59
59 -
60
-
61
-
62
-
63
-
64
-
65
-
66
-
67
-
68
-
69
-
70
-
71
-
72
 |
 |

Nordstrom, Inc. and subsidiaries 41
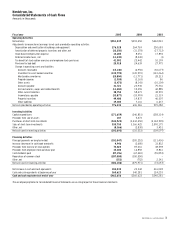
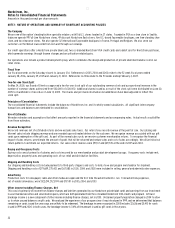
Nordstrom, Inc.
Notes to Consolidated Financial Statements
Amounts in thousands except per share amounts
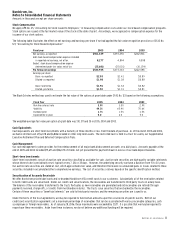
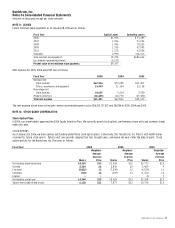
The following table illustrates the sensitivity of fair market value estimates of the investment in asset backed securities given independent
changes in assumptions as of January 28, 2006:
+10% +20% -10% -20%
Gross yield $7,045 $14,090 $(7,045) $(14,090)
Interest expense on issued classes (614) (1,229) 614 1,229
Card holders’ payment rate (376) (944) 55 (416)
Charge offs (2,111) (4,196) 2,138 4,303
Discount rate (2,213) (4,405) 2,233 4,488
These sensitivities are hypothetical and should be used with caution. The effect of an adverse change in a particular assumption on the fair
value of the investment in asset backed securities is calculated without changing any other assumption. Actual changes in one factor may
result in changes in another, which might alter the reported sensitivities.
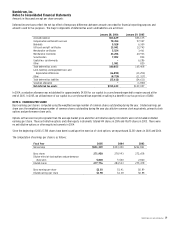
The following table summarizes certain income, expenses and cash flows received from and paid to the VISA Trust:
Fiscal Year 2005 2004 2003
Principal collections reinvested in new receivables $2,597,499 $2,019,162 $1,332,790
Gains on sales of receivables 19,902 8,876 4,920
Income earned on beneficial interests 54,396 46,645 31,926
Cash flows from beneficial interests:
Investment in asset backed securities 129,879 76,381 58,222
Servicing fees 13,309 10,698 7,631
Net credit losses were $25,386, $23,169, and $20,519 for 2005, 2004, and 2003, and receivables past due for more than 30 days were $10,059 and
$9,736 at the end of 2005 and 2004.
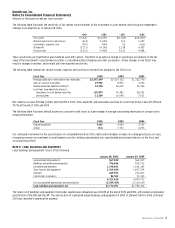
The following table illustrates default projections using net credit losses as a percentage of average outstanding receivables in comparison to
actual performance:
Fiscal Year 2006 2005 2004
Original projection 3.46% 4.04% 5.15%
Actual N/A 3.76% 4.25%
Our continued involvement in the securitization of co-branded Nordstrom VISA credit card receivables includes recording gains/losses on sales,
recognizing income on investment in asset backed securities, holding subordinated, non-subordinated and residual interests in the trust, and
servicing the portfolio.
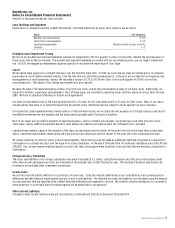
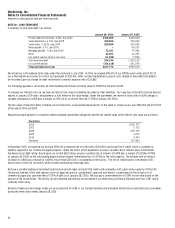
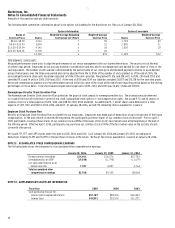
NOTE 9: LAND, BUILDINGS AND EQUIPMENT
Land, buildings and equipment consist of the following:
January 28, 2006 January 29, 2005
Land and land improvements $67,020 $64,037
Buildings and building improvements 796,686 818,733
Leasehold improvements 1,190,041 1,066,383
Store fixtures and equipment 1,919,200 1,817,294
Software 265,951 233,223
Construction in progress 84,532 91,303
4,323,430 4,090,973
Less accumulated depreciation and amortization (2,549,559) (2,310,607)
Land, buildings and equipment, net $1,773,871 $1,780,366
The total cost of buildings and equipment held under capital lease obligations was $20,035 at the end of 2005 and 2004, with related accumulated
amortization of $16,089 and $15,259. The amortization of capitalized leased buildings and equipment of $830, $1,238 and $1,430 in 2005, 2004 and
2003 was recorded in depreciation expense.