Nordstrom 2005 Annual Report Download - page 47
Download and view the complete annual report
Please find page 47 of the 2005 Nordstrom annual report below. You can navigate through the pages in the report by either clicking on the pages listed below, or by using the keyword search tool below to find specific information within the annual report.-
 1
1 -
2
-
3
-
4
-
5
-
6
-
7
-
8
-
9
-
10
-
11
-
12
-
13
-
14
-
15
-
16
-
17
-
18
-
19
-
20
-
21
-
22
-
23
-
24
-
25
-
26
-
27
-
28
-
29
-
30
-
31
-
32
-
33
-
34
-
35
-
36
-
 37
37 -
 38
38 -
 39
39 -
 40
40 -
 41
41 -
 42
42 -
 43
43 -
 44
44 -
 45
45 -
 46
46 -
 47
47 -
 48
48 -
 49
49 -
 50
50 -
 51
51 -
 52
52 -
 53
53 -
 54
54 -
 55
55 -
 56
56 -
 57
57 -
58
-
59
-
60
-
61
-
62
-
63
-
64
-
65
-
66
-
67
-
68
-
69
-
70
-
71
-
72
 |
 |

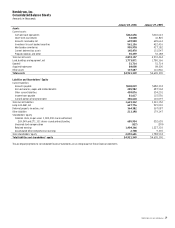
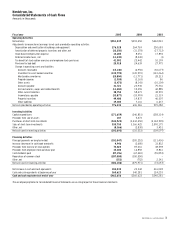
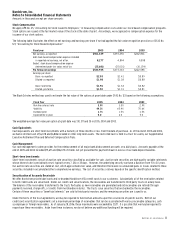
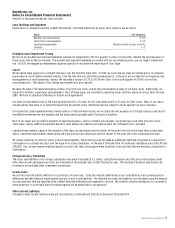
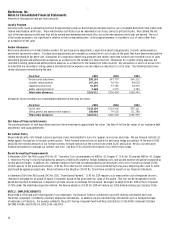
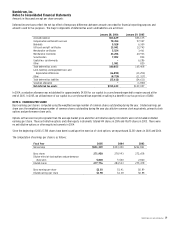
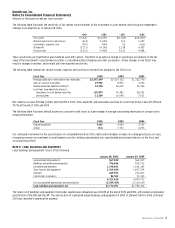
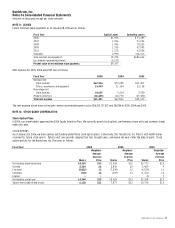
Nordstrom, Inc. and subsidiaries 39
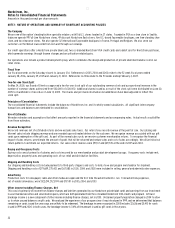
Nordstrom, Inc.
Notes to Consolidated Financial Statements
Amounts in thousands except per share amounts
Deferred income taxes reflect the net tax effect of temporary differences between amounts recorded for financial reporting purposes and
amounts used for tax purposes. The major components of deferred tax assets and liabilities are as follows:
January 28, 2006 January 29, 2005
Accrued expenses $53,629 $56,135
Compensation and benefits accruals 70,454 57,947
Bad debts 5,528 6,309
Gift cards and gift certificates 13,041 12,743
Merchandise certificates 5,524 3,461
Merchandise inventories 23,206 20,933
Securitization 7,892 834
Capital loss carryforwards - 6,286
Other 1,581 820
Total deferred tax assets 180,855 165,468
Land, buildings and equipment basis and
depreciation differences (16,892) (13,294)
Other (8,720) (11,317)
Total deferred tax liabilities (25,612) (24,611)
Valuation allowance - (1,800)
Net deferred tax assets $155,243 $139,057
In 2004, a valuation allowance was established for approximately $4,500 for our capital loss carryforward expected to expire unused at the
end of 2005. In 2005, we utilized more of our capital loss carryforward than expected, resulting in a benefit in our tax provision of $800.
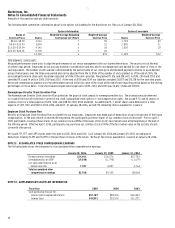
NOTE 6: EARNINGS PER SHARE
Basic earnings per share is computed using the weighted average number of common shares outstanding during the year. Diluted earnings per
share uses the weighted average number of common shares outstanding during the year plus dilutive common stock equivalents, primarily stock
options and performance share units.
Options with an exercise price greater than the average market price and other anti-dilutive equity instruments were not included in diluted
earnings per share. These anti-dilutive options and other equity instruments totaled 144 shares in 2005 and 10,670 shares in 2003. There were
no anti-dilutive options or other equity instruments in 2004.
Since the beginning of 2003, 17,581 shares have been issued upon the exercise of stock options; we repurchased 22,310 shares in 2005 and 2004.
The computation of earnings per share is as follows:
Fiscal Year 2005 2004 2003
Net earnings $551,339 $393,450 $242,841
Basic shares 271,958 278,993 272,658
Dilutive effect of stock options and performance
share units 5,818 5,540 2,820
Diluted shares 277,776 284,533 275,478
Basic earnings per share $2.03 $1.41 $0.89
Diluted earnings per share $1.98 $1.38 $0.88