Nordstrom 2005 Annual Report Download - page 23
Download and view the complete annual report
Please find page 23 of the 2005 Nordstrom annual report below. You can navigate through the pages in the report by either clicking on the pages listed below, or by using the keyword search tool below to find specific information within the annual report.-
 1
1 -
2
-
3
-
4
-
5
-
6
-
7
-
8
-
9
-
10
-
11
-
12
-
 13
13 -
 14
14 -
 15
15 -
 16
16 -
 17
17 -
 18
18 -
 19
19 -
 20
20 -
 21
21 -
 22
22 -
 23
23 -
 24
24 -
 25
25 -
 26
26 -
 27
27 -
 28
28 -
 29
29 -
 30
30 -
 31
31 -
 32
32 -
 33
33 -
34
-
35
-
36
-
37
-
38
-
39
-
40
-
41
-
42
-
43
-
44
-
45
-
46
-
47
-
48
-
49
-
50
-
51
-
52
-
53
-
54
-
55
-
56
-
57
-
58
-
59
-
60
-
61
-
62
-
63
-
64
-
65
-
66
-
67
-
68
-
69
-
70
-
71
-
72
 |
 |

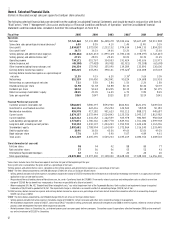
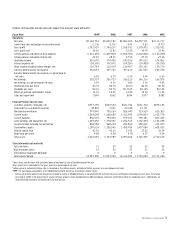
Nordstrom, Inc. and subsidiaries 15
OVERVIEW
In 2005, our same-store sales increased 6.0% on top of our 8.5% increase in 2004. These increases are our two highest annual same-store sales
growth results in the past 10 years. Some other retailers who combine an offering of compelling merchandise and customer service have also
experienced positive sales growth. Our merchandise and selling costs increased in-line with our same-store sales, but our other costs, including
buying and occupancy costs and non-selling labor, remained relatively consistent with last year. As a result of our same-store sales growth and
expense performance, we experienced a significant increase in our operating income. Our earnings before income tax expense as a percentage of
net sales was 11.5% in 2005, the first year that it exceeded 10.0% since we first issued stock to the public in 1971. In addition, our diluted earnings
per share increased 43.5% to $1.98.
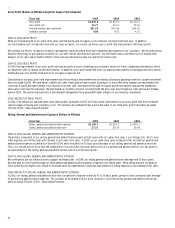
RESULTS OF OPERATIONS
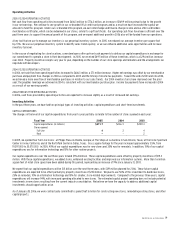
Net Sales (Dollars in Millions)
Fiscal Year 2005 2004 2003
Net sales $7,722.9 $7,131.4 $6,448.7
Net sales increase 8.3% 10.6% 8.5%
Same-store sales increase 6.0% 8.5% 4.1%
Percentage of net sales by merchandise category:
Women’s apparel 35% 36% 36%
Shoes 21% 20% 20%
Cosmetics and women’s accessories 20% 20% 19%
Men’s apparel 18% 18% 17%
Children’s apparel 3% 3% 4%
Other 3% 3% 4%
2005 VS 2004 NET SALES
In our Full-Line stores, our accessories, cosmetics and men’s apparel merchandise categories experienced the largest same-store sales increases.
Our shoe divisions had same-store sales increases. Our women’s apparel merchandise category had mixed same-store sales performance; women’s
intimate, junior and contemporary apparel were the leaders in the women’s category, while women’s special sizes, better and bridge apparel had
same-store sales decreases in 2005.
Our Rack same-store sales increased 14.8% in 2005, on top of last year’s 13.2% increase. Our sales increase was driven by the Rack’s merchandise
mix, especially our ability to offer customers branded merchandise.
Nordstrom Direct’s 2005 sales, including shipping revenue, decreased by 2.5%. Internet sales increased 40.7%. In February 2005, we reduced
our shipping fees, which drove additional Internet sales but reduced our overall shipping revenue. Nordstrom Direct’s 2005 sales, excluding
shipping revenue, improved by 2.4% compared to 2004. As part of the multi-channel strategy (see page 6), we reduced our Direct catalog mailings
significantly beginning in July 2005 and we shifted the merchandise offering to be more aligned with the Full-Line stores. The decrease in the
number of Direct catalog mailings, along with a continuing shift of catalog customers to the Internet, resulted in a drop in catalog sales in 2005.
Total net sales increased as a result of our same-store sales increases as well as from the six Full-Line stores opened since February 2004.
2004 VS 2003 NET SALES
Our net sales increased as our customers responded positively to our merchandise offerings. Both our Full-Line and Rack stores had overall and
same-store sales increases. All of our geographic regions and major merchandise categories also reported overall and same-store sales increases.
The strongest performing areas were accessories, women’s shoes and women’s better apparel, followed by women’s designer and men’s apparel.
Total net sales also benefited from the six Full-Line stores and two Rack stores opened since February 2003, increasing our retail square footage
5% during the last two years.
Sales at Nordstrom Direct increased 30.9% due to Internet-customer order growth and an improved customer order fulfillment rate. Internet sales
increased 53.1% due to an increase in the rate of Web site visits that result in sales and increased Internet advertising. Catalog net sales decreased
in 2004 by 3%, which is consistent with our strategy to shift catalog customers to the Internet.
2006 FORECAST OF SAME-STORE SALES
In March 2006, we opened one Full-Line store; later in 2006, we plan to open one Rack store and relocate one existing Full-Line store, increasing
retail square footage by approximately 1%. We expect 2006 same-store sales to increase 1% to 3%.