Nordstrom 2005 Annual Report Download - page 3
Download and view the complete annual report
Please find page 3 of the 2005 Nordstrom annual report below. You can navigate through the pages in the report by either clicking on the pages listed below, or by using the keyword search tool below to find specific information within the annual report.-
 1
1 -
 2
2 -
 3
3 -
 4
4 -
 5
5 -
 6
6 -
 7
7 -
 8
8 -
 9
9 -
 10
10 -
 11
11 -
 12
12 -
 13
13 -
 14
14 -
15
-
16
-
17
-
18
-
19
-
20
-
21
-
22
-
23
-
24
-
25
-
26
-
27
-
28
-
29
-
30
-
31
-
32
-
33
-
34
-
35
-
36
-
37
-
38
-
39
-
40
-
41
-
42
-
43
-
44
-
45
-
46
-
47
-
48
-
49
-
50
-
51
-
52
-
53
-
54
-
55
-
56
-
57
-
58
-
59
-
60
-
61
-
62
-
63
-
64
-
65
-
66
-
67
-
68
-
69
-
70
-
71
-
72
 |
 |

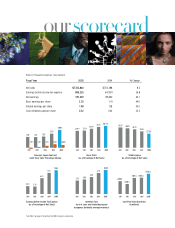
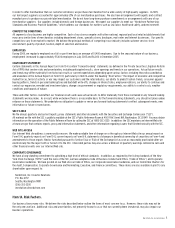
2001 2002 2003 2004 2005 2001 2002 2003 2004 2005 2001 2002 2003 2004 2005
2001 2002 2003 2004 20052001 2002 2003 2004 20052001 2002 2003 2004 2005
$319 $317 $325
$347
$369 32.9%33.2%34.6%36.1%36.7%
3.6%3.3%
6.2%
9.1%
11.5%
3.73 3.85 4.10
4.51
4.84
$488.5
$390.5
$599.3 $606.3
$776.2
30.3%30.0%29.4%28.3%
27.2
%
1.4%
-2.9%8.5%6.0%
4.1%
Earnings before Income Tax Expense
(as a Percentage of Net Sales)1
Sales per Square Foot and
Same-store Sales Percentage Change
Gross Profit
(as a Percentage of Net Sales)
Inventory Turn
(cost of sales and related buying and
occupancy divided by average inventory)
Cash Flow from Operations
(in millions)
SG&A Expense
(as a Percentage of Net Sales)
Dollars in thousands except per share amounts
Fiscal Year 2005 2004 % Change
Net sales $7,722,860 $7,131,388 8.3
Earnings before income tax expense 885,225 647,281 36.8
Net earnings 551,339 393,450 40.1
Basic earnings per share 2.03 1.41 44.0
Diluted earnings per share 1.98 1.38 43.5
Cash dividends paid per share 0.32 0.24 33.3
1See Note 5 on page 12 regarding the 2002 change in accounting
ourscorecard