Nordstrom 2005 Annual Report Download - page 52
Download and view the complete annual report
Please find page 52 of the 2005 Nordstrom annual report below. You can navigate through the pages in the report by either clicking on the pages listed below, or by using the keyword search tool below to find specific information within the annual report.-
 1
1 -
2
-
3
-
4
-
5
-
6
-
7
-
8
-
9
-
10
-
11
-
12
-
13
-
14
-
15
-
16
-
17
-
18
-
19
-
20
-
21
-
22
-
23
-
24
-
25
-
26
-
27
-
28
-
29
-
30
-
31
-
32
-
33
-
34
-
35
-
36
-
37
-
38
-
39
-
40
-
41
-
 42
42 -
 43
43 -
 44
44 -
 45
45 -
 46
46 -
 47
47 -
 48
48 -
 49
49 -
 50
50 -
 51
51 -
 52
52 -
 53
53 -
 54
54 -
 55
55 -
 56
56 -
 57
57 -
 58
58 -
 59
59 -
 60
60 -
 61
61 -
 62
62 -
63
-
64
-
65
-
66
-
67
-
68
-
69
-
70
-
71
-
72
 |
 |

44
Nordstrom, Inc.
Notes to Consolidated Financial Statements
Amounts in thousands except per share amounts
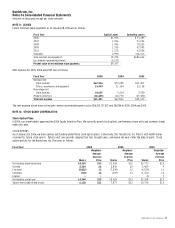
The following table summarizes information about stock options outstanding for the Nordstrom, Inc. Plans as of January 28, 2006:
Options Outstanding Options Exercisable
Range of Weighted-Average Remaining Weighted-Average Weighted-Average
Exercise Prices Shares Contractual Life (Years) Exercise Price Shares Exercise Price
$8.03-$8.99 3,912 7 $9 1,728 $9
$9.00-$12.99 3,899 5 12 2,895 11
$13.00-$19.99 4,143 6 18 1,505 18
$20.00-$26.01 2,390 9 26 — —
14,344 6 $15 6,128 $12
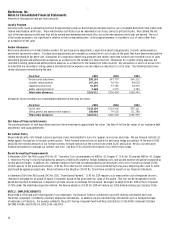
PERFORMANCE SHARE UNITS
We grant performance share units to align the performance of our senior management with our shareholder returns. These units vest at the end
of a three year period. Employees do not pay any monetary consideration and may elect to exchange each unit earned for one share of stock or the
cash equivalent. The number of units earned is determined by the performance of our stock price and dividend payments relative to a pre-defined
group of retail peers over the three-year period and can be adjusted from 0% to 125% of the number of units granted; as of the end of 2005, the
unvested performance share units have been adjusted to 125% of the units granted. We granted 79, 126, and 228 units in 2005, 2004 and 2003, and
cancelled 19, 6 and 34 units in 2005, 2004 and 2003. At the end of 2005 and 2004, our liabilities included $16,927 and $15,278 for the unvested grants.
We record compensation expense over the performance period at the fair value of the stock at the end of each reporting period based on the vesting
percentages on those dates. Total stock-based compensation expense for 2005, 2004, and 2003 was $11,672, $7,816 and $15,970.
Nonemployee Director Stock Incentive Plan
The Nonemployee Director Stock Incentive Plan authorizes the grant of stock awards to nonemployee directors. These awards may be deferred
or issued in the form of restricted or unrestricted stock, nonqualified stock options or stock appreciation rights. We issued 9, 10, and 32 shares of
common stock for a total expense of $270, $202, and $318 for 2005, 2004 and 2003. An additional 15, 7, and 21 shares were deferred for a total
expense of $413, $140, and $183 in 2005, 2004, and 2003. At January 28, 2006, we had 774 remaining shares available for issuance.
Employee Stock Purchase Plan
We offer an Employee Stock Purchase Plan as a benefit to our employees. Employees may make payroll deductions of up to ten percent of their base
compensation. At the end of each six-month offering period, the participants purchase shares of our common stock at a discount. Prior to April 1,
2005, participants could purchase shares of our common stock at 85% of the lower of the stock’s fair market value at the beginning or the end of
the offering period. Effective April 1, 2005, participants may purchase our common stock at 90% of the fair market value on the last day of each
six-month offer period.
We issued 757, 977, and 1,295 shares under this plan in 2005, 2004, and 2003. As of January 28, 2006 and January 29, 2005, we had payroll
deductions totaling $5,497 and $5,097 for the purchase of shares in the future. We have 1,363 shares available for issuance at January 28, 2006.
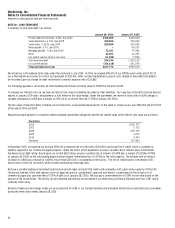
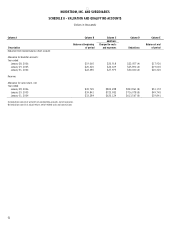
NOTE 13: ACCUMULATED OTHER COMPREHENSIVE EARNINGS
The following table shows the components of accumulated other comprehensive earnings:
January 28, 2006 January 29, 2005 January 31, 2004
Foreign currency translation $14,461 $16,276 $15,783
Unrecognized loss on SERP (19,540) (11,798) (11,679)
Fair value adjustment to asset
backed securities 7,787 4,857 4,764
Total accumulated other
comprehensive earnings $2,708 $9,335 $8,868
NOTE 14: SUPPLEMENTARY CASH FLOW INFORMATION
Fiscal Year 2005 2004 2003
Cash paid during the year for:
Interest (net of capitalized interest) $57,187 $88,876 $96,824
Income taxes 343,891 253,576 121,271