Nordstrom 2005 Annual Report Download - page 24
Download and view the complete annual report
Please find page 24 of the 2005 Nordstrom annual report below. You can navigate through the pages in the report by either clicking on the pages listed below, or by using the keyword search tool below to find specific information within the annual report.-
 1
1 -
2
-
3
-
4
-
5
-
6
-
7
-
8
-
9
-
10
-
11
-
12
-
13
-
 14
14 -
 15
15 -
 16
16 -
 17
17 -
 18
18 -
 19
19 -
 20
20 -
 21
21 -
 22
22 -
 23
23 -
 24
24 -
 25
25 -
 26
26 -
 27
27 -
 28
28 -
 29
29 -
 30
30 -
 31
31 -
 32
32 -
 33
33 -
 34
34 -
35
-
36
-
37
-
38
-
39
-
40
-
41
-
42
-
43
-
44
-
45
-
46
-
47
-
48
-
49
-
50
-
51
-
52
-
53
-
54
-
55
-
56
-
57
-
58
-
59
-
60
-
61
-
62
-
63
-
64
-
65
-
66
-
67
-
68
-
69
-
70
-
71
-
72
 |
 |

16
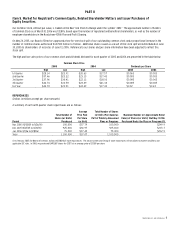
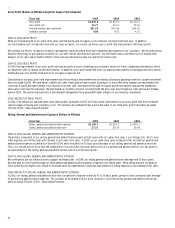
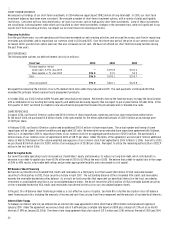
Gross Profit (Dollars in Millions Except Per Square Foot Amounts)
Fiscal Year 2005 2004 2003
Gross profit $2,834.8 $2,572.0 $2,233.1
Gross profit rate 36.7% 36.1% 34.6%
Average inventory per square foot $51.25 $52.46 $54.81
Inventory turnover 4.84 4.51 4.10
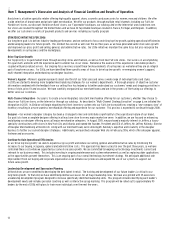
2005 VS 2004 GROSS PROFIT
While we showed growth in our same-store sales, we held buying and occupancy costs relatively consistent with last year. In addition,
our merchandise costs increased in-line with our sales increases. As a result, we drove a gross profit rate improvement of 60 basis points.
We continue our efforts to improve inventory management while providing fresh and compelling merchandise to our customers. We utilized existing
and new technology to gain greater visibility into our sales trends and inventory position. Our merchant teams used these tools to expand their
analysis of our sales and on-hand content to drive sales growth and increase our inventory turnover rate.
2004 VS 2003 GROSS PROFIT
In 2004, the improvement in our gross profit rate was primarily a result of meeting our customers’ desire for fresh, compelling merchandise, which
increased the sales of regular priced merchandise. In addition, gross profit benefited from our ongoing improvement in managing inventory and by
holding buying costs and the fixed portion of occupancy expenses flat.
Contributing to our gross profit rate improvement was the continuous improvement we are making utilizing our perpetual inventory system investment,
which we made in 2003. We have better visibility into sales trends and on-hand content, allowing us to more effectively manage our merchandise; the
result was a significant improvement in our inventory turnover rate. Increased sell-through of regular-priced merchandise reduced the markdowns
necessary to sell slow moving goods. We maintained our inventory at levels consistent with the prior year, even though our sales and square footage
grew in 2004. The overall improvements in merchandise management have generated higher margins on our inventory investments.
2006 FORECAST OF GROSS PROFIT
In 2006, if we achieve our planned same-store sales growth, we expect a net 10 to 20 basis point improvement in our gross profit rate from continued
sales leverage on buying and occupancy costs. This includes an estimated 15 basis point decrease to our 2006 gross profit rate when we adopt
SFAS No. 123(R), “Share-Based Payment.”
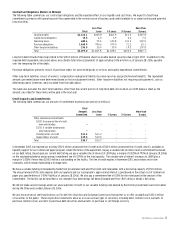
Selling, General and Administrative Expenses (Dollars in Millions)
Fiscal Year 2005 2004 2003
Selling, general and administrative expenses $2,100.7 $2,020.2 $1,899.1
Selling, general and administrative rate 27.2% 28.3% 29.4%
2005 VS 2004 SELLING, GENERAL AND ADMINISTRATIVE EXPENSES
The primary component of our selling, general and administrative expenses that varies with our same-store sales is our selling costs. Most of our
other expenses do not fluctuate with changes in our same-store sales. In 2005, as our same-store sales increased 6.0%, we held our general and
administrative expenses essentially in-line with 2004, which resulted in a 110 basis point decrease in our selling, general and administrative rate.
This is our second year in a row that the combination of our net sales increases and control of our general and administrative costs has given us
an improvement in the selling, general and administrative rate of over 100 basis points.
2004 VS 2003 SELLING, GENERAL AND ADMINISTRATIVE EXPENSES
We continued to use our infrastructure to support increased sales. In 2004, our selling, general and administrative rate improved 110 basis points.
We were able to control and leverage our fixed general and administrative expenses, especially non-selling labor. While selling expense increased in
2004, primarily from higher costs linked to increased sales, we experienced a slight rate improvement in selling expense as a percentage of net sales.
2006 FORECAST OF SELLING, GENERAL AND ADMINISTRATIVE EXPENSES
In 2006, our selling, general and administrative rate is expected to improve overall by 10 to 20 basis points, primarily from continued sales leverage
on general and administrative expenses. This includes an estimated 20 basis point increase to our 2006 selling, general and administrative rate
when we adopt SFAS No. 123(R), “Share-Based Payment.”