Nordstrom 2005 Annual Report Download - page 20
Download and view the complete annual report
Please find page 20 of the 2005 Nordstrom annual report below. You can navigate through the pages in the report by either clicking on the pages listed below, or by using the keyword search tool below to find specific information within the annual report.-
 1
1 -
2
-
3
-
4
-
5
-
6
-
7
-
8
-
9
-
 10
10 -
 11
11 -
 12
12 -
 13
13 -
 14
14 -
 15
15 -
 16
16 -
 17
17 -
 18
18 -
 19
19 -
 20
20 -
 21
21 -
 22
22 -
 23
23 -
 24
24 -
 25
25 -
 26
26 -
 27
27 -
 28
28 -
 29
29 -
 30
30 -
31
-
32
-
33
-
34
-
35
-
36
-
37
-
38
-
39
-
40
-
41
-
42
-
43
-
44
-
45
-
46
-
47
-
48
-
49
-
50
-
51
-
52
-
53
-
54
-
55
-
56
-
57
-
58
-
59
-
60
-
61
-
62
-
63
-
64
-
65
-
66
-
67
-
68
-
69
-
70
-
71
-
72
 |
 |

12
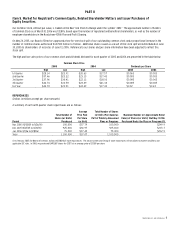
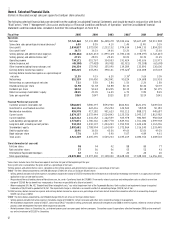
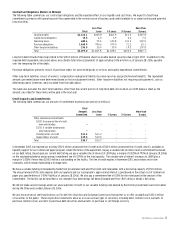
Item 6. Selected Financial Data.
(Dollars in thousands except sales per square foot and per share amounts)
The following selected financial data are derived from the audited Consolidated Financial Statements and should be read in conjunction with Item 1A
“Risk Factors,” Item 7 “Management’s Discussion and Analysis of Financial Condition and Results of Operation,” and the Consolidated Financial
Statements and the related notes included in Item 8 of this Annual Report on Form 10-K.
Fiscal Year
2005
2004
2003
20024
2001
20006
Operations
Net sales $7,722,860 $7,131,388 $6,448,678 $5,944,656 $5,607,687 $5,511,908
Same-store sales percentage increase (decrease)1 6.0% 8.5% 4.1% 1.4% (2.9%) 0.3%
Gross profit 2,834,837 2,572,000 2,233,132 1,974,634 1,844,133 1,854,220
Gross profit rate2 36.7% 36.1% 34.6% 33.2% 32.9% 33.6%
Selling, general, and administrative expenses (2,100,666) (2,020,233) (1,899,129) (1,783,210) (1,698,497) (1,722,247)
Selling, general, and administrative rate3 27.2% 28.3% 29.4% 30.0% 30.3% 31.2%
Operating income 734,171 551,767 334,003 191,424 145,636 131,973
Interest expense, net (45,300) (77,428) (90,952) (81,921) (75,038) (62,698)
Other income including finance charges, net 196,354 172,942 155,090 139,289 133,890 130,600
Earnings before income tax expense 885,225 647,281 398,141 195,6245 204,488 167,018
Earnings before income tax expense as a percentage of
net sales 11.5% 9.1% 6.2% 3.3%5 3.6% 3.0%
Net earnings 551,339 393,450 242,841 90,224 124,688 101,918
Net earnings as a percentage of net sales 7.1% 5.5% 3.8% 1.5% 2.2% 1.8%
Diluted earnings per share $1.98 $1.38 $0.88 $0.33 $0.46 $0.39
Dividends per share $0.32 $0.24 $0.205 $0.19 $0.18 $0.175
Return on average shareholders’ equity 28.4% 23.0% 16.2% 6.7% 9.8% 8.4%
Sales per square foot $369 $347 $325 $317 $319 $341
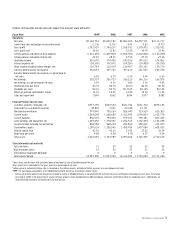
Financial Position (at year end)
Customer accounts receivable, net $566,815 $580,397 $594,900 $606,861 $621,491 $649,504
Investment in asset backed securities 561,136 422,416 272,294 124,543 58,539 50,183
Merchandise inventories 955,978 917,182 901,623 953,112 888,172 945,687
Current assets 2,874,157 2,572,444 2,524,843 2,125,356 2,095,317 1,812,982
Current liabilities 1,623,312 1,341,152 1,122,559 925,978 986,587 950,568
Land, buildings and equipment, net 1,773,871 1,780,366 1,807,778 1,849,961 1,761,082 1,599,938
Long-term debt, including current portion 934,394 1,030,107 1,234,243 1,350,595 1,424,242 1,112,296
Shareholders’ equity 2,092,681 1,788,994 1,634,009 1,372,864 1,316,245 1,233,445
Debt-to-capital ratio 30.9% 36.5% 43.0% 49.6% 52.0% 49.2%
Book value per share 7.76 6.59 5.90 5.07 4.89 4.61
Total assets 4,921,349 4,605,390 4,569,233 4,185,269 4,084,356 3,608,503
Store Information (at year end)
Full-Line stores 98 94 92 88 80 77
Rack and other stores 57 56 56 55 52 43
International Façonnable boutiques 32 31 31 23 24 20
Total square footage 20,070,000 19,397,000 19,138,000 18,428,000 17,048,000 16,056,000
1Same-stores include stores that have been open at least one full year at the beginning of the year.
2Gross profit rate is calculated as the gross profit as a percentage of net sales.
3Selling, general, and administrative rate is calculated as the selling, general, and administrative expenses as a percentage of net sales.
42002 - The items below amounted to a net $90,638 charge ($71,041, net of tax, or $0.26 per diluted share):
• Selling, general and administrative expenses included an impairment charge of $15,570 related to the write-down of an information technology investment in a supply chain software
application in our private label business.
• We purchased the outstanding shares of Nordstrom.com, Inc. series C preferred stock for $70,000. The minority interest purchase and reintegration costs resulted in a one-time
charge of $53,168. No tax benefit was recognized as there was no possibility of a future tax benefit.
• When we adopted SFAS No. 142, “Goodwill and Other Intangible Assets,” our initial impairment test of the Façonnable Business Unit resulted in an impairment charge to acquired
tradename of $16,133 and to goodwill of $5,767. The impairment charge is reflected as a cumulative effect of accounting change ($13,359, net of tax).
5In 2002, earnings before income tax expense and earnings before income tax expense as a percentage of net sales do not include the cumulative effect of an accounting change of
$13,359, net of tax of $8,541.
62000 - The items below amounted to a net $56,084 charge ($34,211, net of tax, or $0.13 per diluted share):
• Selling, general and administrative expenses included a charge of $13,000 for certain severance and other costs related to a change in management.
• We recorded an impairment charge of $10,227, consisting of $9,627 recorded in selling, general and administrative expenses and $600 in interest expense, related to several software
projects under development that were either impaired or obsolete.
• We held common shares in Streamline, Inc., an Internet grocery and consumer goods delivery company. Streamline ceased its operations effective November 2000, and we wrote off
our entire investment of $32,857 in Streamline.