Nordstrom 2005 Annual Report Download - page 21
Download and view the complete annual report
Please find page 21 of the 2005 Nordstrom annual report below. You can navigate through the pages in the report by either clicking on the pages listed below, or by using the keyword search tool below to find specific information within the annual report.-
 1
1 -
2
-
3
-
4
-
5
-
6
-
7
-
8
-
9
-
10
-
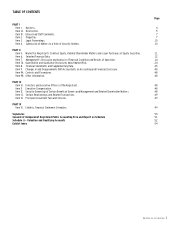 11
11 -
 12
12 -
 13
13 -
 14
14 -
 15
15 -
 16
16 -
 17
17 -
 18
18 -
 19
19 -
 20
20 -
 21
21 -
 22
22 -
 23
23 -
 24
24 -
 25
25 -
 26
26 -
 27
27 -
 28
28 -
 29
29 -
 30
30 -
 31
31 -
32
-
33
-
34
-
35
-
36
-
37
-
38
-
39
-
40
-
41
-
42
-
43
-
44
-
45
-
46
-
47
-
48
-
49
-
50
-
51
-
52
-
53
-
54
-
55
-
56
-
57
-
58
-
59
-
60
-
61
-
62
-
63
-
64
-
65
-
66
-
67
-
68
-
69
-
70
-
71
-
72
 |
 |

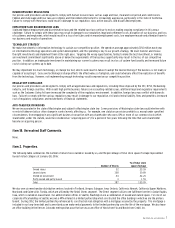
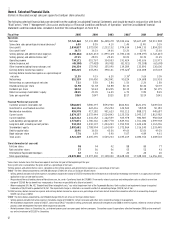
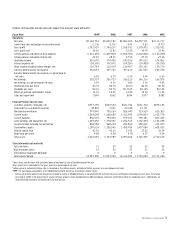
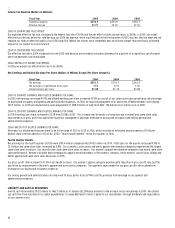
Nordstrom, Inc. and subsidiaries 13
(Dollars in thousands except sales per square foot and per share amounts)
Fiscal Year
19994
1998
1997
1996
1995
Operations
Net sales $5,144,754 $5,049,182 $4,864,604 $4,457,931 $4,113,717
Same-store sales percentage increase (decrease)1 (1.1%) (2.7%) 4.0% 0.6% (0.7%)
Gross profit 1,781,929 1,704,237 1,568,791 1,378,472 1,310,931
Gross profit rate2 34.6% 33.8% 32.2% 30.9% 31.9%
Selling, general, and administrative expenses (1,516,259) (1,429,837) (1,338,235) (1,232,860) (1,136,069)
Selling, general, and administrative rate3 29.5% 28.3% 27.5% 27.7% 27.6%
Operating income 265,670 274,400 230,556 145,612 174,862
Interest expense, net (50,396) (47,091) (34,250) (39,400) (39,295)
Other income including finance charges, net 116,783 110,414 110,907 135,331 134,179
Earnings before income tax expense 332,057 337,723 307,213 241,543 269,746
Earnings before income tax expense as a percentage of
net sales 6.5% 6.7% 6.3% 5.4% 6.6%
Net earnings 202,557 206,723 186,213 146,316 163,556
Net earnings as a percentage of net sales 3.9% 4.1% 3.8% 3.3% 4.0%
Diluted earnings per share $0.73 $0.70 $0.60 $0.45 $0.50
Dividends per share $0.16 $0.15 $0.1325 $0.125 $0.125
Return on average shareholders’ equity 16.3% 15.0% 12.8% 10.2% 11.9%
Sales per square foot $349 $362 $384 $377 $382
Financial Position (at year end)
Customer accounts receivable, net $557,190 $560,564 $621,704 $661,332 $874,103
Investment in asset backed securities 38,830 7,097 20,158 31,791 —
Merchandise inventories 797,845 750,269 826,045 719,919 626,303
Current assets 1,564,648 1,668,689 1,613,492 1,549,819 1,612,776
Current liabilities 866,509 794,490 979,031 795,321 833,443
Land, buildings and equipment, net 1,429,492 1,378,006 1,252,513 1,152,454 1,103,298
Long-term debt, including current portion 804,982 868,234 420,865 380,632 439,943
Shareholders’ equity 1,185,614 1,300,545 1,458,950 1,457,084 1,408,053
Debt-to-capital ratio 42.5% 42.1% 31.9% 27.2% 32.3%
Book value per share 4.48 4.58 4.78 4.57 4.34
Total assets 3,062,081 3,103,689 2,890,664 2,726,495 2,732,619
Store Information (at year end)
Full-Line stores 71 67 65 62 58
Rack and other stores 33 30 27 21 20
International Façonnable boutiques 0 0 0 0 0
Total square footage 14,487,000 13,593,000 12,614,000 11,754,000 10,713,000
1Same-stores include stores that have been open at least one full year at the beginning of the year.
2Gross profit rate is calculated as the gross profit as a percentage of net sales.
3Selling, general, and administrative rate is calculated as the selling, general, and administrative expenses as a percentage of net sales.
41999 - The item below amounted to a net $10,000 charge ($6,111, net of tax, or $0.02 per diluted share):
• Selling, general and administrative expenses included a charge of $10,000 primarily associated with the restructuring of our information technology services area. The charge
consisted of $4,053 in the disposition of several software projects under development, $2,685 in employee severance and $1,206 in other miscellaneous costs. Additionally, we
recorded $2,056 related to settlement costs for two lawsuits.