Nordstrom 2005 Annual Report Download - page 26
Download and view the complete annual report
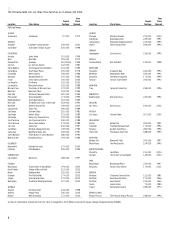
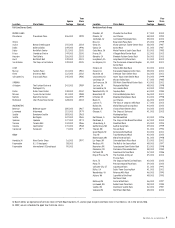
Please find page 26 of the 2005 Nordstrom annual report below. You can navigate through the pages in the report by either clicking on the pages listed below, or by using the keyword search tool below to find specific information within the annual report.-
 1
1 -
2
-
3
-
4
-
5
-
6
-
7
-
8
-
9
-
10
-
11
-
12
-
13
-
14
-
15
-
 16
16 -
 17
17 -
 18
18 -
 19
19 -
 20
20 -
 21
21 -
 22
22 -
 23
23 -
 24
24 -
 25
25 -
 26
26 -
 27
27 -
 28
28 -
 29
29 -
 30
30 -
 31
31 -
 32
32 -
 33
33 -
 34
34 -
 35
35 -
 36
36 -
37
-
38
-
39
-
40
-
41
-
42
-
43
-
44
-
45
-
46
-
47
-
48
-
49
-
50
-
51
-
52
-
53
-
54
-
55
-
56
-
57
-
58
-
59
-
60
-
61
-
62
-
63
-
64
-
65
-
66
-
67
-
68
-
69
-
70
-
71
-
72
 |
 |

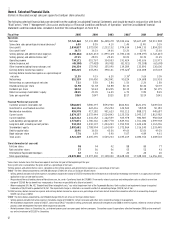
18
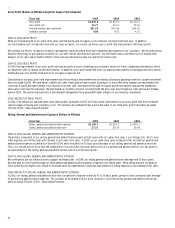
Income Tax Expense (Dollars in Millions)
Fiscal Year 2005 2004 2003
Income tax expense $333.9 $253.8 $155.3
Effective tax rate 37.7% 39.2% 39.0%
2005 VS 2004 INCOME TAX EXPENSE
Our expected effective tax rate, considering the federal tax rate of 35.0% and the net effect of state income taxes, is 38.5%. In 2005, our actual
effective tax rate was below this rate because our 2004 tax expense, which was finalized in the third quarter of 2005, was less than we expected; we
reduced our reserve when the audits of our 2000 and 2001 federal tax returns were completed; and, we utilized a larger than previously estimated
amount of our capital loss carryforward.
2004 VS 2003 INCOME TAX EXPENSE
Our effective tax rate in 2004 increased from the 2003 rate because we recorded a valuation allowance for a portion of a capital loss carryforward
which we deemed to be unrealizable.
2006 FORECAST OF INCOME TAX EXPENSE
In 2006, we expect our effective tax rate to be 38.5%.
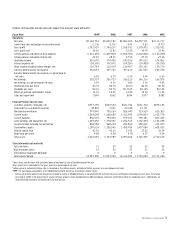
Net Earnings and Diluted Earnings Per Share (Dollars in Millions Except Per Share Amounts)
Fiscal Year 2005 2004 2003
Net earnings $551.3 $393.5 $242.8
Net earnings as a percentage of net sales 7.1% 5.5% 3.8%
Diluted earnings per share $1.98 $1.38 $0.88
2005 VS 2004 NET EARNINGS AND DILUTED EARNINGS PER SHARE
In 2005, net earnings increased 40.1% and diluted earnings per share increased 43.5% as a result of our same-store sales growth and sales leverage
on buying and occupancy and general and administrative expenses. In 2004, we incurred prepayment costs and wrote off deferred debt costs totaling
$20.9 million, or $0.05 per diluted share, upon prepayment of $198.2 million of long-term debt. We did not incur similar costs in 2005.
2004 VS 2003 NET EARNINGS AND DILUTED EARNINGS PER SHARE
In 2004, earnings per share increased to $1.38 from $0.88 in 2003. This increase was driven by a strong increase in overall and same-store sales,
improvements in gross profit through better inventory management, and sales leverage on buying and occupancy and selling, general and
administrative expenses.
2006 FORECAST OF DILUTED EARNINGS PER SHARE
We expect our diluted earnings per share to be in the range of $2.15 to $2.23 in 2006, which includes an estimated annual expense of $0.06 per
diluted share from the adoption of SFAS No. 123(R), ”Share-Based Payment“ in the first quarter of 2006.
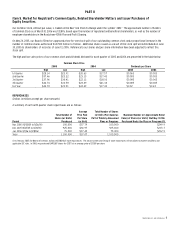
Fourth Quarter Results
Net earnings for the fourth quarter of 2005 were $190.4 million compared with $140.0 million in 2004. Total sales for the quarter increased 9.3% to
$2.3 billion and same-store sales increased by 5.8%. Our cosmetics, accessories and men’s apparel merchandise categories experienced the largest
same-store sales increases. Our shoe divisions had same-store sales increases. Our women’s apparel merchandise categories had mixed same-store
sales performance. Women’s intimate and contemporary apparel were the leaders in the women’s category, while women’s special sizes, bridge and
better apparel had same-store sales decreases in 2005.
Our gross profit rate increased to 37.5% from 36.6% last year. Our women’s apparel category experienced a reduction in gross profit rate, but this
was offset by improvement in the men’s apparel and accessories categories. The quarterly improvement in our gross profit rate resulted from
leverage on our buying and occupancy expenses.
Our selling, general and administrative rate improved 70 basis points from 26.9% to 26.2%, primarily from leverage on our general and
administrative expenses.
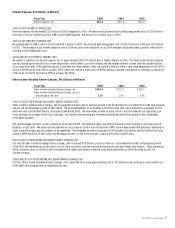
LIQUIDITY AND CAPITAL RESOURCES
Overall, cash increased by $102.0 million to $462.7 million as of January 28, 2006 due primarily to the increase in our net earnings in 2005. We utilized
our cash flow from operations for capital expenditures, to repay debt and to return capital to our shareholders through dividends and repurchases
of our common stock.