Nissan 2005 Annual Report Download - page 99
Download and view the complete annual report
Please find page 99 of the 2005 Nissan annual report below. You can navigate through the pages in the report by either clicking on the pages listed below, or by using the keyword search tool below to find specific information within the annual report.-
 1
1 -
2
-
3
-
4
-
5
-
6
-
7
-
8
-
9
-
10
-
11
-
12
-
13
-
14
-
15
-
16
-
17
-
18
-
19
-
20
-
21
-
22
-
23
-
24
-
25
-
26
-
27
-
28
-
29
-
30
-
31
-
32
-
33
-
34
-
35
-
36
-
37
-
38
-
39
-
40
-
41
-
42
-
43
-
44
-
45
-
46
-
47
-
48
-
49
-
50
-
51
-
52
-
53
-
54
-
55
-
56
-
57
-
58
-
59
-
60
-
61
-
62
-
63
-
64
-
65
-
66
-
67
-
68
-
69
-
70
-
71
-
72
-
73
-
74
-
75
-
76
-
77
-
78
-
79
-
80
-
81
-
82
-
83
-
84
-
85
-
86
-
87
-
88
-
 89
89 -
 90
90 -
 91
91 -
 92
92 -
 93
93 -
 94
94 -
 95
95 -
 96
96 -
 97
97 -
 98
98 -
 99
99 -
 100
100 -
 101
101 -
 102
102 -
 103
103 -
 104
104 -
 105
105 -
 106
106 -
 107
107 -
 108
108 -
 109
109 -
110
-
111
-
112
-
113
-
114
 |
 |

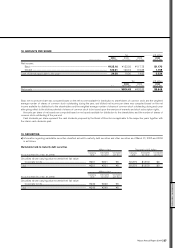
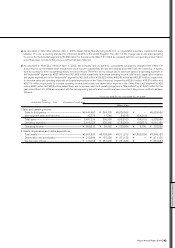
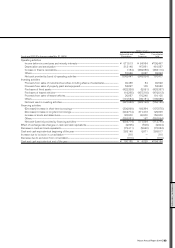
2) Summarized consolidated statements of income by business segment
Millions of yen Thousands of U.S. dollars
Automobile and Sales Consolidated Automobile and Sales Consolidated
Fiscal year 2004
(For the year ended Mar. 31, 2005)
Eliminations Financing total Eliminations Financing total
Net sales.................................................................................... ¥8,164,332 ¥411,945 ¥8,576,277 $76,302,168 $3,849,953 $80,152,121
Cost of sales........................................................................... 6,094,196 257,073 6,351,269 56,955,103 2,402,551 59,357,654
Gross profit.............................................................................. 2,070,136 154,872 2,225,008 19,347,065 1,447,402 20,794,467
Operating income............................................................... 787,603 73,557 861,160 7,360,775 687,449 8,048,224
Operating income as a percentage of net sales
...... 9.6% 17.9% 10.0% 9.6% 17.9% 10.0%
Net financial cost................................................................ (10,371) (11) (10,382) (96,925) (103) (97,028)
Income before income taxes and
minority interests.............................................................. 720,764 72,469 793,233 6,736,113 677,280 7,413,393
Net income............................................................................... ¥ 472,680 ¥ 39,601 ¥ 512,281 $ 4,417,570 $ 370,103 $ 4,787,673
Total net financial cost................................................... ¥ (10,371) ¥ (11) ¥ (10,382) $ (96,925) $ (103) $ (97,028)
Interest on lease obligation........................................ (4,097) (20) (4,117) (38,290) (187) (38,477)
Intersegment elimination.............................................. (12,524) — (12,524) (117,047) — (117,047)
Net financial cost for segment ................................ 6,250 9 6,259 58,411 84 58,495
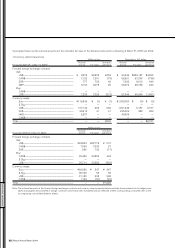
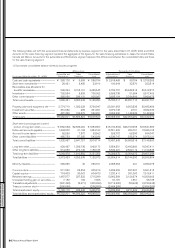
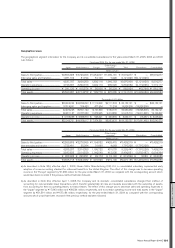
Millions of yen
Automobile and Sales Consolidated
Fiscal year 2003
(For the year ended Mar. 31, 2004)
Eliminations Financing total
Net sales.................................................................................... ¥7,063,230 ¥365,989 ¥7,429,219
Cost of sales........................................................................... 5,098,056 212,116 5,310,172
Gross profit.............................................................................. 1,965,174 153,873 2,119,047
Operating income............................................................... 760,045 64,810 824,855
Operating income as a percentage of net sales
......... 10.8% 17.7% 11.1%
Net financial cost................................................................ (15,669) (30) (15,699)
Income before income taxes and
minority interests.............................................................. 671,513 64,984 736,497
Net income............................................................................... ¥ 465,329 ¥ 38,338 ¥ 503,667
Total net financial cost................................................... ¥ (15,669) ¥ (30) ¥ (15,699)
Interest on lease obligation........................................ (4,603) (20) (4,623)
Intersegment elimination.............................................. (5,322) — (5,322)
Net financial cost for segment ................................ (5,744) (10) (5,754)
Millions of yen
Automobile and Sales Consolidated
Fiscal year 2002
(For the year ended Mar. 31, 2003)
Eliminations Financing total
Net sales.................................................................................... ¥6,432,720 ¥395,868 ¥6,828,588
Cost of sales........................................................................... 4,617,368 254,956 4,872,324
Gross profit.............................................................................. 1,815,352 140,912 1,956,264
Operating income............................................................... 677,348 59,882 737,230
Operating income as a percentage of net sales
......... 10.5% 15.1% 10.8%
Net financial cost................................................................ (16,543) 3 (16,540)
Income before income taxes and
minority interests.............................................................. 634,818 59,806 694,624
Net income............................................................................... ¥ 458,611 ¥ 36,554 ¥ 495,165
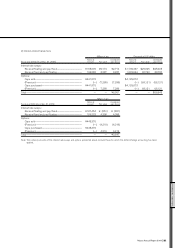
Total net financial cost................................................... ¥ (16,543) ¥ 3 ¥ (16,540)
Intersegment elimination.............................................. (5,677) — (5,677)
Net financial cost for segment ................................ (10,866) 3 (10,863)
Net financial cost for segment ................................ (5,744) (10) (5,754)
FINANCIAL SECTION
Nissan Annual Report 2004 97