Nissan 2005 Annual Report Download - page 90
Download and view the complete annual report
Please find page 90 of the 2005 Nissan annual report below. You can navigate through the pages in the report by either clicking on the pages listed below, or by using the keyword search tool below to find specific information within the annual report.-
 1
1 -
2
-
3
-
4
-
5
-
6
-
7
-
8
-
9
-
10
-
11
-
12
-
13
-
14
-
15
-
16
-
17
-
18
-
19
-
20
-
21
-
22
-
23
-
24
-
25
-
26
-
27
-
28
-
29
-
30
-
31
-
32
-
33
-
34
-
35
-
36
-
37
-
38
-
39
-
40
-
41
-
42
-
43
-
44
-
45
-
46
-
47
-
48
-
49
-
50
-
51
-
52
-
53
-
54
-
55
-
56
-
57
-
58
-
59
-
60
-
61
-
62
-
63
-
64
-
65
-
66
-
67
-
68
-
69
-
70
-
71
-
72
-
73
-
74
-
75
-
76
-
77
-
78
-
79
-
 80
80 -
 81
81 -
 82
82 -
 83
83 -
 84
84 -
 85
85 -
 86
86 -
 87
87 -
 88
88 -
 89
89 -
 90
90 -
 91
91 -
 92
92 -
 93
93 -
 94
94 -
 95
95 -
 96
96 -
 97
97 -
 98
98 -
 99
99 -
 100
100 -
101
-
102
-
103
-
104
-
105
-
106
-
107
-
108
-
109
-
110
-
111
-
112
-
113
-
114
 |
 |
FINANCIAL SECTION
Nissan Annual Report 2004
88
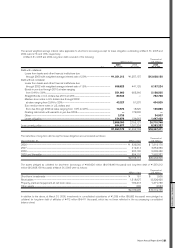
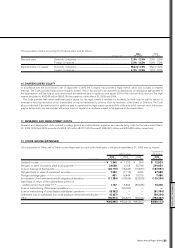
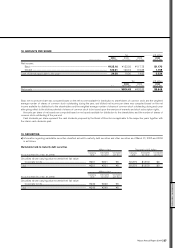
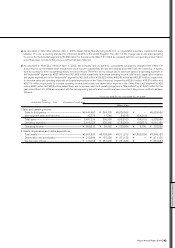
Marketable other securities
Millions of yen Thousands of U.S. dollars
Acquisition Carrying Unrealized Acquisition Carrying Unrealized
Fiscal year 2004 (As of Mar. 31, 2005) cost value gain (loss) cost value gain (loss)
Securities whose carrying value exceeds
their acquisition cost:
Stock................................................................................................................................ ¥3,781 ¥15,833 ¥12,052 $35,336 $147,972 $112,636
Debt securities......................................................................................................... 19 20 1 178 187 9
Others ............................................................................................................................. 15 18 3 140 168 28
Subtotal................................................................................................................................... ¥3,815 ¥15,871 ¥12,056 $35,654 $148,327 $112,673
Securities whose acquisition cost exceeds
their carrying value:
Stock................................................................................................................................ ¥ 679 ¥ 428 ¥ (251) $ 6,346 $ 4,000 $ (2,346)
Others ............................................................................................................................. 214 191 (23) 2,000 1,785 (215)
Subtotal................................................................................................................................... ¥ 893 ¥ 619 ¥ (274) $ 8,346 $ 5,785 $ (2,561)
Total........................................................................................................................................... ¥4,708 ¥16,490 ¥11,782 $44,000 $154,112 $110,112
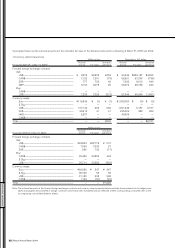
Millions of yen
Acquisition Carrying Unrealized
Fiscal year 2003 (As of Mar. 31, 2004) cost value gain (loss)
Securities whose carrying value exceeds
their acquisition cost:
Stock................................................................................................................................ ¥1,042 ¥7,934 ¥6,892
Debt securities......................................................................................................... 19 20 1
Subtotal................................................................................................................................... ¥1,061 ¥7,954 ¥6,893
Securities whose acquisition cost exceeds
their carrying value:
Stock................................................................................................................................ ¥2,486 ¥1,939 ¥ (547)
Subtotal................................................................................................................................... ¥2,486 ¥1,939 ¥ (547)
Total........................................................................................................................................... ¥3,547 ¥9,893 ¥6,346
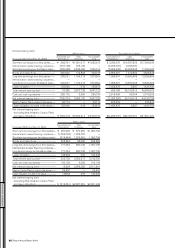
b) Sales of securities classified as other securities with aggregate gain and loss are summarized as follows:
Thousands of
Millions of yen U.S. dollars
2004 2003 2002 2004
For the years ended Mar. 31, 2005 Mar. 31, 2004 Mar. 31, 2003 Mar. 31, 2005
Sales proceeds....................................................................................................................................................................... ¥2,032 ¥4,048 ¥12,770 $18,991
Aggregate gain....................................................................................................................................................................... 1,225 1,500 3,446 11,449
Aggregate loss ....................................................................................................................................................................... (13) (32) (3,167) (121)
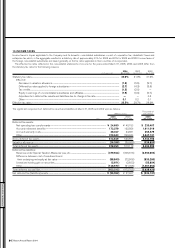
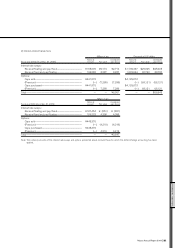
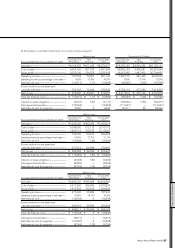
c) The redemption schedule for securities with maturity dates classified as other securities and held-to-maturity debt securities as of March 31,
2005 is summarized as follows:
Millions of yen
Due in Due after one Due after five
one year or year through years through Due after
Fiscal year 2004 (As of Mar. 31, 2005) less five years ten years ten years
Government bonds.............................................................................................................................................................. ¥20 ¥0 ¥0 ¥0
Corporate bonds ................................................................................................................................................................... 147 0 54 0
Others ............................................................................................................................................................................................ 04 00
Total................................................................................................................................................................................................. ¥167 ¥4 ¥54 ¥0