Nissan 2005 Annual Report Download - page 11
Download and view the complete annual report
Please find page 11 of the 2005 Nissan annual report below. You can navigate through the pages in the report by either clicking on the pages listed below, or by using the keyword search tool below to find specific information within the annual report.-
 1
1 -
 2
2 -
 3
3 -
 4
4 -
 5
5 -
 6
6 -
 7
7 -
 8
8 -
 9
9 -
 10
10 -
 11
11 -
 12
12 -
 13
13 -
 14
14 -
 15
15 -
 16
16 -
 17
17 -
 18
18 -
 19
19 -
 20
20 -
 21
21 -
 22
22 -
23
-
24
-
25
-
26
-
27
-
28
-
29
-
30
-
31
-
32
-
33
-
34
-
35
-
36
-
37
-
38
-
39
-
40
-
41
-
42
-
43
-
44
-
45
-
46
-
47
-
48
-
49
-
50
-
51
-
52
-
53
-
54
-
55
-
56
-
57
-
58
-
59
-
60
-
61
-
62
-
63
-
64
-
65
-
66
-
67
-
68
-
69
-
70
-
71
-
72
-
73
-
74
-
75
-
76
-
77
-
78
-
79
-
80
-
81
-
82
-
83
-
84
-
85
-
86
-
87
-
88
-
89
-
90
-
91
-
92
-
93
-
94
-
95
-
96
-
97
-
98
-
99
-
100
-
101
-
102
-
103
-
104
-
105
-
106
-
107
-
108
-
109
-
110
-
111
-
112
-
113
-
114
 |
 |
Nissan Annual Report 2004 9
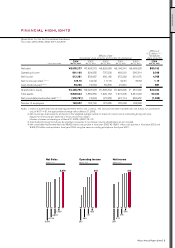
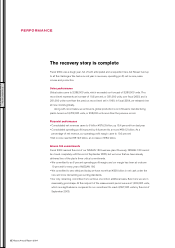
PERFORMANCE
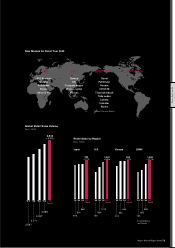
Europe
350Z Roadster
Murano
Pathfinder
Navara
Micra C+C
Japan
Serena
Otti
Compact wagon
M-class sedan
Minicar
GOM*/Mexico
Quest
Pathfinder
Navara
Infiniti M
Tiida hatchback
Tiida sedan
Lafesta
Interstar
Xterra
*General Overseas Markets
US/Canada
New Models for Fiscal Year 2005
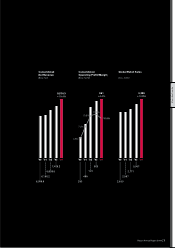
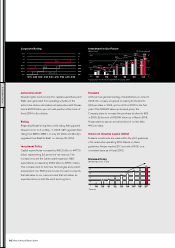
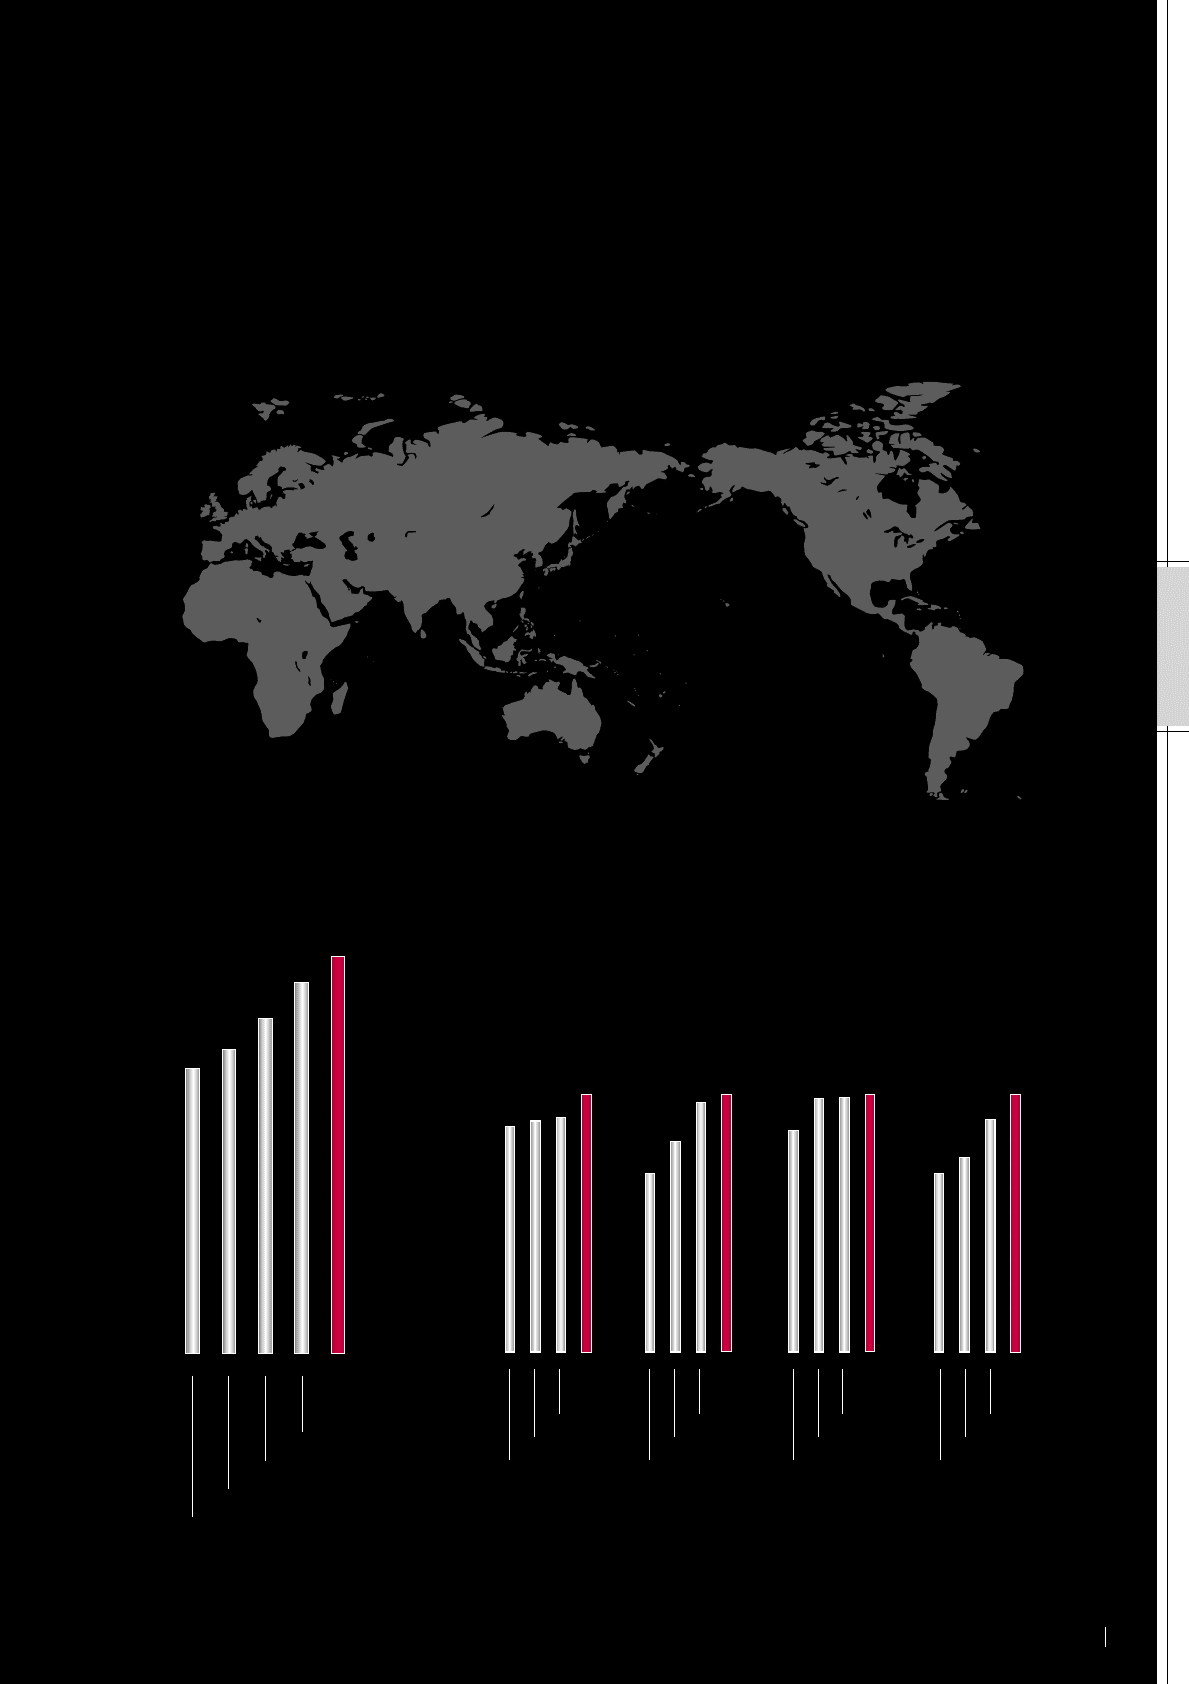
’01 ’02 ’03 ’04 ’05
Forecast
2,597
2,771
3,057
3,388
3,618
+6.8%
816
837
848
933
+10%
’02 ’03 ’04 ’05
Forecast
726
859
1,013
1,047
+3.3%
’02 ’03 ’04 ’05
Forecast
474
542
544
550
+1.1%
’02 ’03 ’04 ’05
Forecast
755
822
983
1,088
+10.7%
’02 ’03 ’04 ’05
Forecast
Global Retail Sales Volume
(Units: 1000s)
Retail Sales by Region
(Units: 1000s)
Japan U.S. Europe GOM*
*Including Mexico
and Canada