Nissan 2005 Annual Report Download - page 85
Download and view the complete annual report
Please find page 85 of the 2005 Nissan annual report below. You can navigate through the pages in the report by either clicking on the pages listed below, or by using the keyword search tool below to find specific information within the annual report.-
 1
1 -
2
-
3
-
4
-
5
-
6
-
7
-
8
-
9
-
10
-
11
-
12
-
13
-
14
-
15
-
16
-
17
-
18
-
19
-
20
-
21
-
22
-
23
-
24
-
25
-
26
-
27
-
28
-
29
-
30
-
31
-
32
-
33
-
34
-
35
-
36
-
37
-
38
-
39
-
40
-
41
-
42
-
43
-
44
-
45
-
46
-
47
-
48
-
49
-
50
-
51
-
52
-
53
-
54
-
55
-
56
-
57
-
58
-
59
-
60
-
61
-
62
-
63
-
64
-
65
-
66
-
67
-
68
-
69
-
70
-
71
-
72
-
73
-
74
-
 75
75 -
 76
76 -
 77
77 -
 78
78 -
 79
79 -
 80
80 -
 81
81 -
 82
82 -
 83
83 -
 84
84 -
 85
85 -
 86
86 -
 87
87 -
 88
88 -
 89
89 -
 90
90 -
 91
91 -
 92
92 -
 93
93 -
 94
94 -
 95
95 -
96
-
97
-
98
-
99
-
100
-
101
-
102
-
103
-
104
-
105
-
106
-
107
-
108
-
109
-
110
-
111
-
112
-
113
-
114
 |
 |

FINANCIAL SECTION
Nissan Annual Report 2004 83
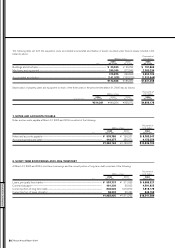
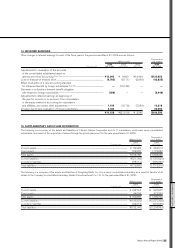
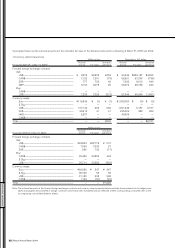
12. OTHER INCOME (EXPENSES)
The components of “Other, net” in “Other income (expenses)” for each of the three years in the period ended March 31, 2005 were as follows:
Thousands of
Millions of yen U.S. dollars
2004 2003 2002 2004
For the years ended Mar. 31, 2005 Mar. 31, 2004 Mar. 31, 2003 Mar. 31, 2005
Dividend income.................................................................................................................................................................. ¥ 1,340 ¥ 1,270 ¥ 954 $ 12,523
Net gain on sales of property, plant and equipment.............................................................................. 24,038 4,163 58,796 224,654
Loss on disposal of fixed assets............................................................................................................................ (20,115) (18,449) (15,587) (187,991)
Net gain (loss) on sales of investment securities.................................................................................... 7,232 (7,113) 4,324 67,589
Foreign exchange gain.................................................................................................................................................. 801 16,444 18,318 7,486
Amortization of net retirement benefit obligation at transition...................................................... (11,795) (13,936) (23,923) (110,234)
Gain (loss) on return of the substitutional portion of
welfare pension fund plans (Note 9)...................................................................................................................... 1,107 5,594 (30,945) 10,346
Loss on restructuring of European operations .......................................................................................... —(26,164) — —
Loss on restructuring of consolidated subsidiaries’ operations................................................... (8,752) ——(81,794)
Settlement loss on withdrawal from multi-employer retirement benefit plan................... (6,337) ——(59,224)
Other............................................................................................................................................................................................. (80,514) (44,821) (48,444) (752,467)
¥(92,995) ¥(83,012) ¥(36,507) $(869,112)
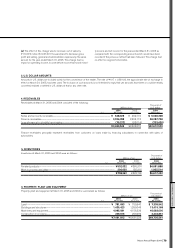
11. RESEARCH AND DEVELOPMENT COSTS
Research and development costs included in selling, general and administrative expenses and manufacturing costs for the years ended March
31, 2005, 2004 and 2003 amounted to ¥398,148 million ($3,721,009 thousand), ¥354,321 million and ¥300,330 million, respectively.
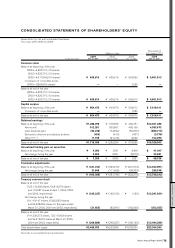
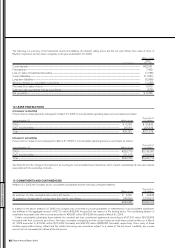
10. SHAREHOLDERS’ EQUITY
In accordance with the Commercial Code of Japan (the “Code”), the Company has provided a legal reserve, which was included in retained
earnings. The Code provides that an amount equal to at least 10% of the amount to be disbursed as distributions of earnings be appropriated to
the legal reserve until the total of such reserve and the additional paid-in capital account equals 25% of the common stock account. The legal
reserve amounted to ¥53,838 million ($503,159 thousand) as of both March 31, 2005 and 2004.
The Code provides that neither additional paid-in capital nor the legal reserve is available for dividends, but both may be used to reduce or
eliminate a deficit by resolution of the shareholders or may be transferred to common stock by resolution of the Board of Directors. The Code
also provides that if the total amount of additional paid-in capital and the legal reserve exceeds 25% of the amount of common stock, the excess
may be distributed to the shareholders either as a return of capital or as dividends subject to the approval of the shareholders.
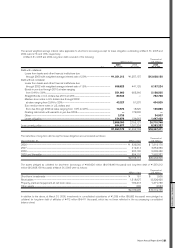
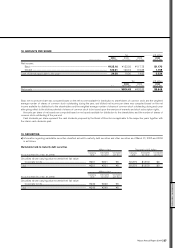
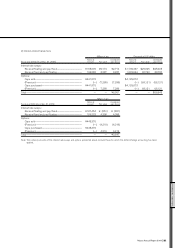
The assumptions used in accounting for the above plans were as follows:
2004 2003
For the years ended Mar. 31, 2005 Mar. 31, 2004
Discount rates Domestic companies............................................................................................................................... 2.3% - 2.5% 2.3% - 2.5%
Foreign companies.................................................................................................................................... 2.5% - 9.5% 5.0% - 7.0%
Expected return on assets Domestic companies............................................................................................................................... Mainly 3.0% Mainly 3.0%
Foreign companies.................................................................................................................................... 2.2% - 9.5% 7.0% - 9.0%