Nissan 2005 Annual Report Download - page 15
Download and view the complete annual report
Please find page 15 of the 2005 Nissan annual report below. You can navigate through the pages in the report by either clicking on the pages listed below, or by using the keyword search tool below to find specific information within the annual report.-
 1
1 -
2
-
3
-
4
-
 5
5 -
 6
6 -
 7
7 -
 8
8 -
 9
9 -
 10
10 -
 11
11 -
 12
12 -
 13
13 -
 14
14 -
 15
15 -
 16
16 -
 17
17 -
 18
18 -
 19
19 -
 20
20 -
 21
21 -
 22
22 -
 23
23 -
 24
24 -
 25
25 -
26
-
27
-
28
-
29
-
30
-
31
-
32
-
33
-
34
-
35
-
36
-
37
-
38
-
39
-
40
-
41
-
42
-
43
-
44
-
45
-
46
-
47
-
48
-
49
-
50
-
51
-
52
-
53
-
54
-
55
-
56
-
57
-
58
-
59
-
60
-
61
-
62
-
63
-
64
-
65
-
66
-
67
-
68
-
69
-
70
-
71
-
72
-
73
-
74
-
75
-
76
-
77
-
78
-
79
-
80
-
81
-
82
-
83
-
84
-
85
-
86
-
87
-
88
-
89
-
90
-
91
-
92
-
93
-
94
-
95
-
96
-
97
-
98
-
99
-
100
-
101
-
102
-
103
-
104
-
105
-
106
-
107
-
108
-
109
-
110
-
111
-
112
-
113
-
114
 |
 |

Nissan Annual Report 2004 13
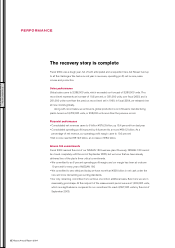
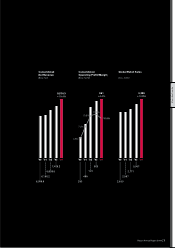
1,100
1,000
900
800
700
FY03
OP FY04
OP
Forex
Scope of
consolidation
Volume
/mix Sales
expenses
Purchasing
cost
reduction
Product
enrichment
R&D
expenses
Manu-
facturing
expenses
Warranty
expenses G&A
and
others
824.9 -78
+31
+284
–114
+131
–92
–44 –15 –41
–25.7 861.2
Impact on Operating Profit
(Billion Yen)
1,200
1,000
800
600
400
200
0
-200
CashDebt
Net debt
at end
of FY03 Net debt
at the end
of FY04
Operating
activities
before tax Tax paid Investing
activities
Dividend
paid Other
financial
activities
FX rate
impact
+1,082.2
–203.0 –450.7
–26.0
–94.0 –99.1 +10.0 205.8
–13.6
Treasury
stock
Net Cash Flow (automotive)
(Billion Yen)
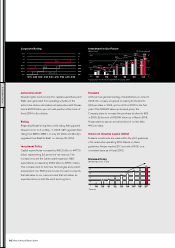
PERFORMANCE
Net Income
Net non-operating expenses totaled ¥5.5 billion, ¥9.7
billion lower than last year. This was primarily due to a ¥5.3
billion decrease in financial costs and a ¥5.3 billion
increase in equity in earnings of unconsolidated
subsidiaries and affiliates, thanks mainly to Renault. Net
extraordinary losses totaled ¥62.5 billion, ¥10.7 billion
lower than last year, mainly due to the sale of the site of
the former Murayama plant. Net income before taxes came
to ¥793.2 billion. Income taxes totaled ¥258.0 billion, with
an effective consolidated tax rate of 33 percent. Minority
interests amounted to ¥22.9 billion, mainly from Yulon
Nissan Motor. As a result, net income reached ¥512.3
billion, an increase of ¥8.6 billion.
FINANCIAL POSITION
Balance Sheet
In 2004, total consolidated assets increased by 25.3
percent to ¥9,848.5 billion.
Current assets increased by 36.4 percent, or ¥1,372.4
billion, to ¥5,139.4 billion. This increase included changes
in the scope of consolidation by ¥271.1 billion and an
increase in sales finance receivables by ¥840.6 billion
thanks to increased sales in the U.S. Fixed assets
increased by 15.1 percent, or ¥616.7 billion, to ¥4,708.0
billion. Property, plant and equipment valuation increased
by ¥593.6 billion, mainly due to capital expenditures of
¥477.5 billion and an increase in leased vehicles.
Current liabilities increased by 28.1 percent, or ¥872.2
billion, to ¥3,974.7 billion. This increase included changes
in the scope of consolidation of ¥144.4 billion and an
increase in short-term borrowings for sales financing of
¥558.5 billion.
In 2004, total shareholder equity increased from
¥2,024.0 billion to ¥2,465.8 billion. This gain was primarily
due to net income of ¥512.3 billion, offset by dividends
paid totaling ¥101.2 billion. Consolidated shareholder
equity represented 29 percent of total revenues and 25
percent of total assets.
Cash Flow
Cash from operating activities was ¥369.4 billion, below
the previous year’s level of ¥797.4 billion. This drop was
primarily caused by a ¥331.2 billion increase in finance
receivables in the U.S. and Japan. There were also
increases in inventory and income tax paid.
Cash used for investing activities increased by ¥108.9
billion to ¥865.0 billion. This increase was mainly due to an
increase of leased vehicles in the U.S.
Cash from financing activities totaled ¥521.0 billion,
including an increase in short-term borrowing of ¥666.2
billion, offset by ¥94 billion for the payment of dividends
and ¥26 billion for the acquisition of treasury stock.
In total, cash and cash equivalents increased by ¥95.6
billion to ¥289.8 billion from fiscal 2004.