Nissan 2005 Annual Report Download - page 110
Download and view the complete annual report
Please find page 110 of the 2005 Nissan annual report below. You can navigate through the pages in the report by either clicking on the pages listed below, or by using the keyword search tool below to find specific information within the annual report.-
 1
1 -
2
-
3
-
4
-
5
-
6
-
7
-
8
-
9
-
10
-
11
-
12
-
13
-
14
-
15
-
16
-
17
-
18
-
19
-
20
-
21
-
22
-
23
-
24
-
25
-
26
-
27
-
28
-
29
-
30
-
31
-
32
-
33
-
34
-
35
-
36
-
37
-
38
-
39
-
40
-
41
-
42
-
43
-
44
-
45
-
46
-
47
-
48
-
49
-
50
-
51
-
52
-
53
-
54
-
55
-
56
-
57
-
58
-
59
-
60
-
61
-
62
-
63
-
64
-
65
-
66
-
67
-
68
-
69
-
70
-
71
-
72
-
73
-
74
-
75
-
76
-
77
-
78
-
79
-
80
-
81
-
82
-
83
-
84
-
85
-
86
-
87
-
88
-
89
-
90
-
91
-
92
-
93
-
94
-
95
-
96
-
97
-
98
-
99
-
 100
100 -
 101
101 -
 102
102 -
 103
103 -
 104
104 -
 105
105 -
 106
106 -
 107
107 -
 108
108 -
 109
109 -
 110
110 -
 111
111 -
 112
112 -
 113
113 -
 114
114
 |
 |

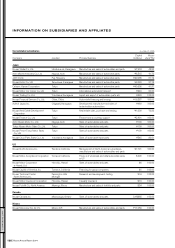
Subsidiaries and affiliates accounted for by the equity method
As of Mar. 31, 2005
Capital Nissan
Company Location Principal business (millions) share*(%)
Japan
Nissan Diesel Motor Co., Ltd. Ageo Saitama Manufacture and sales of automobiles and parts ¥65,835 24.38
Kinugawa Rubber Industrial Co., Ltd. Chiba, Chiba Manufacture and sales of automotive parts ¥5,655 20.25
France
Renault Billancourt Manufacture and sales of automobiles and parts €1,086 15.00
Other subsidiaries and affiliates accounted for by the equity method 17 companies
Total subsidiaries and affiliates accounted for by the equity method 20 companies
* Percent of voting rights held by Nissan Motor Co., Ltd.
Nissan Annual Report 2004
108
CORPORATE DATA