Nissan 2005 Annual Report Download - page 86
Download and view the complete annual report
Please find page 86 of the 2005 Nissan annual report below. You can navigate through the pages in the report by either clicking on the pages listed below, or by using the keyword search tool below to find specific information within the annual report.-
 1
1 -
2
-
3
-
4
-
5
-
6
-
7
-
8
-
9
-
10
-
11
-
12
-
13
-
14
-
15
-
16
-
17
-
18
-
19
-
20
-
21
-
22
-
23
-
24
-
25
-
26
-
27
-
28
-
29
-
30
-
31
-
32
-
33
-
34
-
35
-
36
-
37
-
38
-
39
-
40
-
41
-
42
-
43
-
44
-
45
-
46
-
47
-
48
-
49
-
50
-
51
-
52
-
53
-
54
-
55
-
56
-
57
-
58
-
59
-
60
-
61
-
62
-
63
-
64
-
65
-
66
-
67
-
68
-
69
-
70
-
71
-
72
-
73
-
74
-
75
-
 76
76 -
 77
77 -
 78
78 -
 79
79 -
 80
80 -
 81
81 -
 82
82 -
 83
83 -
 84
84 -
 85
85 -
 86
86 -
 87
87 -
 88
88 -
 89
89 -
 90
90 -
 91
91 -
 92
92 -
 93
93 -
 94
94 -
 95
95 -
 96
96 -
97
-
98
-
99
-
100
-
101
-
102
-
103
-
104
-
105
-
106
-
107
-
108
-
109
-
110
-
111
-
112
-
113
-
114
 |
 |

FINANCIAL SECTION
Nissan Annual Report 2004
84
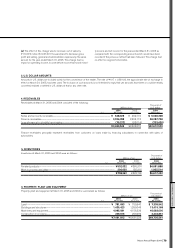
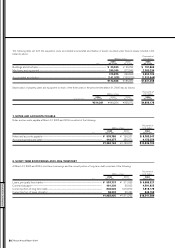
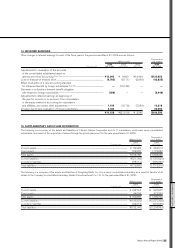
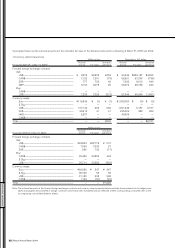
13. INCOME TAXES
Income taxes in Japan applicable to the Company and its domestic consolidated subsidiaries consist of corporation tax, inhabitants’ taxes and
enterprise tax, which, in the aggregate, resulted in a statutory rate of approximately 41% for 2004 and 42% for 2003 and 2002. Income taxes of
the foreign consolidated subsidiaries are based generally on the tax rates applicable in their countries of incorporation.
The effective tax rates reflected in the consolidated statements of income for the years ended March 31, 2005, 2004 and 2003 differ from
the statutory tax rates for the following reasons:
2004 2003 2002
For the years ended Mar. 31, 2005 Mar. 31, 2004 Mar. 31, 2003
Statutory tax rates ................................................................................................................................................................................................................. 40.6% 41.9% 41.9%
Effect of:
Decrease in valuation allowance ................................................................................................................................................................ (1.9) (5.5) (9.7)
Different tax rates applied to foreign subsidiaries....................................................................................................................... (2.7) (4.3) (3.8)
Tax credits..................................................................................................................................................................................................................... (1.5) (2.0) —
Equity in earnings of unconsolidated subsidiaries and affiliates...................................................................................... (1.9) (0.6) (0.7)
Adjustments in deferred tax assets and liabilities due to change in tax rate......................................................... —— 0.8
Other.................................................................................................................................................................................................................................. 0.1 0.2 0.1
Effective tax rates.................................................................................................................................................................................................................. 32.5% 29.7% 28.6%
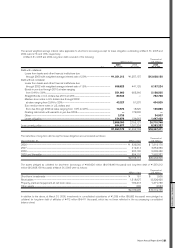
The significant components of deferred tax assets and liabilities at March 31, 2005 and 2004 were as follows:
Thousands of
Millions of yen U.S. dollars
2004 2003 2004
As of Mar. 31, 2005 Mar. 31, 2004 Mar. 31, 2005
Deferred tax assets:
Net operating loss carryforwards..................................................................................................................................... ¥ 24,660 ¥ 40,150 $ 230,467
Accrued retirement benefits................................................................................................................................................. 172,379 162,926 1,611,019
Accrued warranty costs............................................................................................................................................................ 38,047 44,381 355,579
Other........................................................................................................................................................................................................ 379,543 299,344 3,547,131
Gross deferred tax assets............................................................................................................................................................... 614,629 546,801 5,744,196
Valuation allowance.............................................................................................................................................................................. (36,369) (36,689) (339,897)
Total deferred tax assets ................................................................................................................................................................. 578,260 510,112 5,404,299
Deferred tax liabilities:
Reserves under Special Taxation Measures Law, etc. ................................................................................... (379,924) (306,316) (3,550,692)
Difference between cost of investments and
their underlying net equity at fair value .................................................................................................................... (88,840) (72,508) (830,280)
Unrealized holding gain on securities........................................................................................................................... (5,971) (2,853) (55,804)
Other........................................................................................................................................................................................................ (128,577) (91,028) (1,201,654)
Total deferred tax liabilities............................................................................................................................................................ (603,312) (472,705) (5,638,430)
Net deferred tax (liabilities) assets.......................................................................................................................................... ¥ (25,052) ¥ 37,407 $ (234,131)