Nissan 2005 Annual Report Download - page 13
Download and view the complete annual report
Please find page 13 of the 2005 Nissan annual report below. You can navigate through the pages in the report by either clicking on the pages listed below, or by using the keyword search tool below to find specific information within the annual report.-
 1
1 -
2
-
 3
3 -
 4
4 -
 5
5 -
 6
6 -
 7
7 -
 8
8 -
 9
9 -
 10
10 -
 11
11 -
 12
12 -
 13
13 -
 14
14 -
 15
15 -
 16
16 -
 17
17 -
 18
18 -
 19
19 -
 20
20 -
 21
21 -
 22
22 -
 23
23 -
24
-
25
-
26
-
27
-
28
-
29
-
30
-
31
-
32
-
33
-
34
-
35
-
36
-
37
-
38
-
39
-
40
-
41
-
42
-
43
-
44
-
45
-
46
-
47
-
48
-
49
-
50
-
51
-
52
-
53
-
54
-
55
-
56
-
57
-
58
-
59
-
60
-
61
-
62
-
63
-
64
-
65
-
66
-
67
-
68
-
69
-
70
-
71
-
72
-
73
-
74
-
75
-
76
-
77
-
78
-
79
-
80
-
81
-
82
-
83
-
84
-
85
-
86
-
87
-
88
-
89
-
90
-
91
-
92
-
93
-
94
-
95
-
96
-
97
-
98
-
99
-
100
-
101
-
102
-
103
-
104
-
105
-
106
-
107
-
108
-
109
-
110
-
111
-
112
-
113
-
114
 |
 |
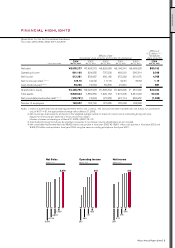
Nissan Annual Report 2004 11
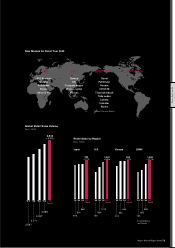
PERFORMANCE
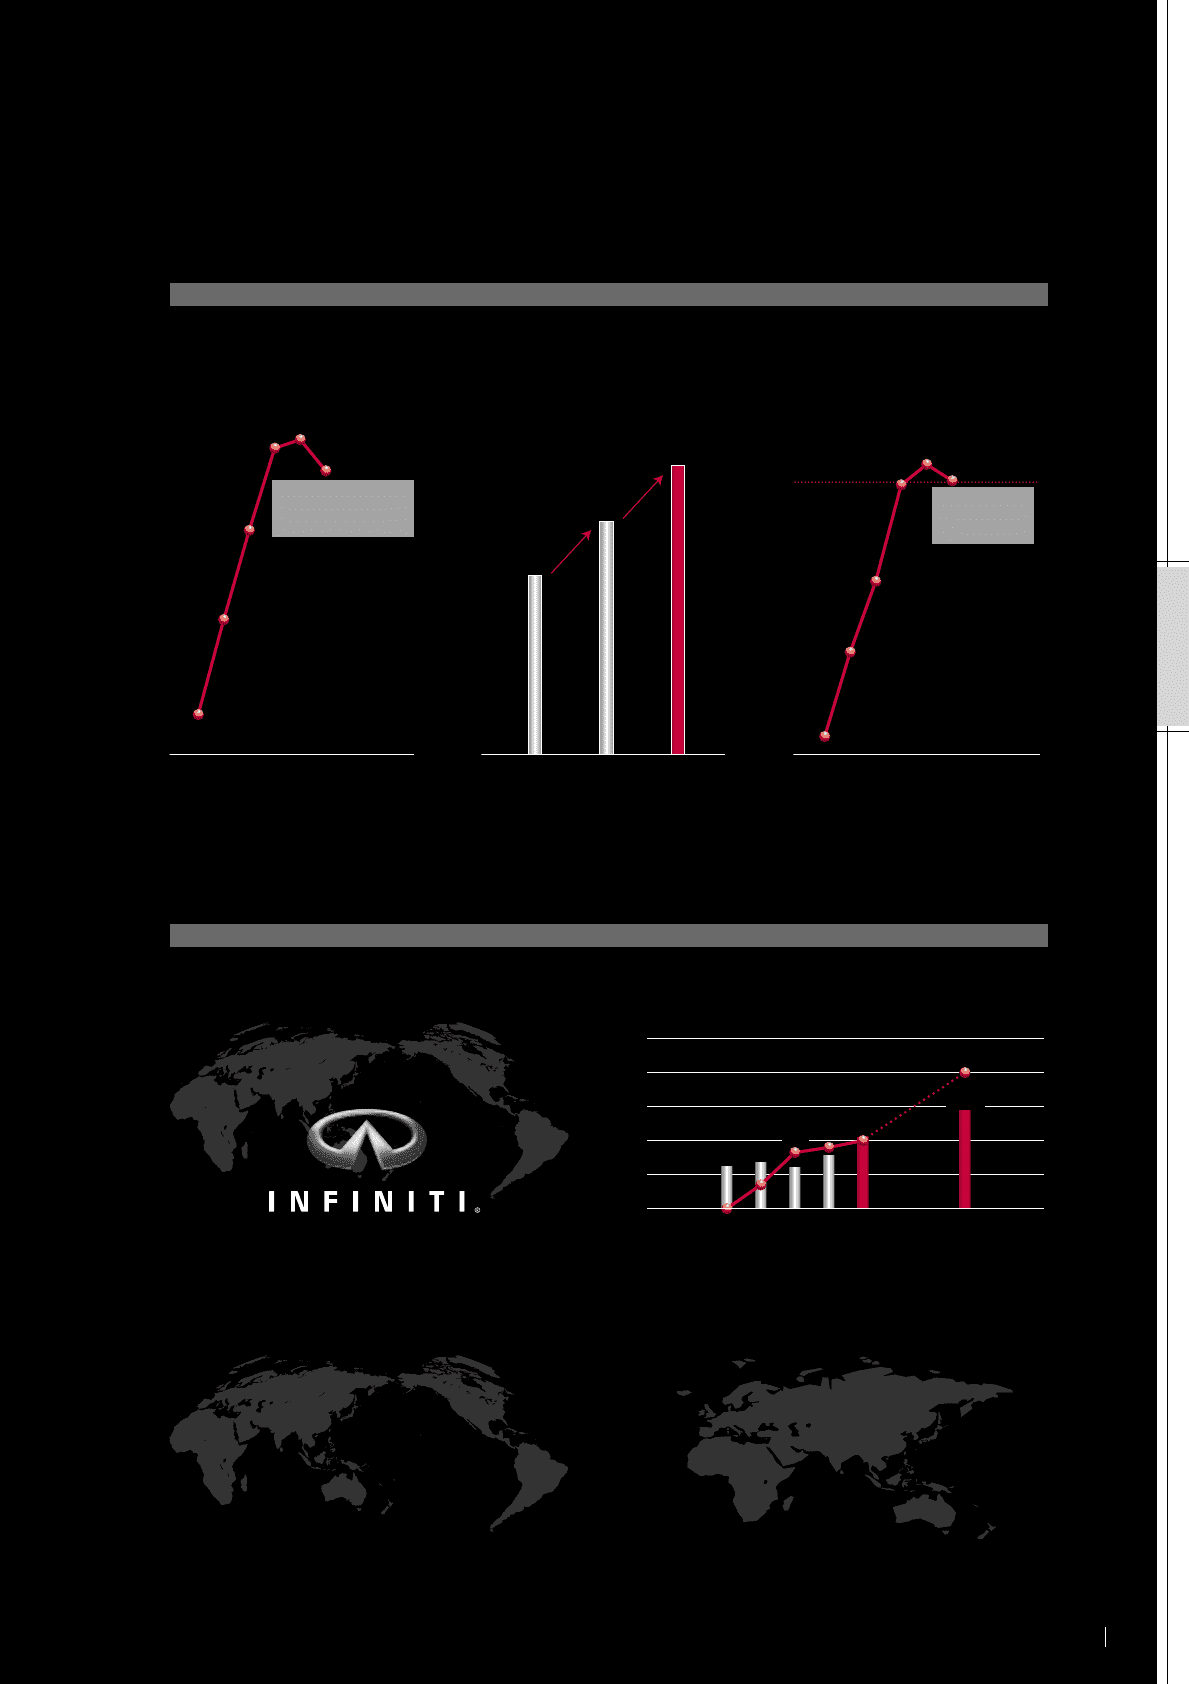
FOUR MAJOR BREAKTHROUGHS
Infiniti Global Tier-1 bBrand Light Commercial Vehicles (LCV)
Leading Competitive Countries (LCCs) Geographic Expansion
2,597
3,388
4,200
’01 ’04 ’08
Commitment
+791
+812
NISSAN Value-Up Sales Volume
(Units: 1000s)
THREE CRITICAL COMMITMENTS
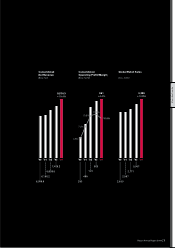
Consolidated Operating Profit Margin
COP margin (%)
Top level
operating profit margin
among global automakers
1.4%
4.75%
7.9%
10.8% 10.0%
11.1%
NRP NISSAN
180
NISSAN
Value-Up
’99 ’00 ’01 ’02 ’03 ’04 ’05 ’06 ’07
Return on Invested Capital (auto)
(%)
ROIC
average of 20%
1.3%
7.5%
12.7%
19.8% 20.1%*
21.3%
NRP NISSAN
180
NISSAN
Value-Up
’99 ’00 ’01 ’02 ’03 ’04 ’05 ’06 ’07
*Same scope pf consolidation as P&L, excluding
change of cash compared to fiscal year 2003
750
600
450
300
150
0
(Thousand units)
10
8
6
4
2
0
(% of consolidated operating margin)
187 203
182 234 312
434
+40%
-0.5%
3.3%
1.4%
3.6%
8.0%
4.0%
’00 ’01 ’02 ’03 ’04 ’07
Russia
Middle
East
Japan*
China
Korea
Taiwan
North America
*Japan launch after NISSAN Value-Up
Russia
China
Egypt
India Thailand
Pakistan
Eastern
Europe Gulf
Countrles
Hungary
Romania
Egypt India
China
Thailand
Vietnam Mexico
Mercosur