Nissan 2005 Annual Report Download - page 9
Download and view the complete annual report
Please find page 9 of the 2005 Nissan annual report below. You can navigate through the pages in the report by either clicking on the pages listed below, or by using the keyword search tool below to find specific information within the annual report.-
 1
1 -
 2
2 -
 3
3 -
 4
4 -
 5
5 -
 6
6 -
 7
7 -
 8
8 -
 9
9 -
 10
10 -
 11
11 -
 12
12 -
 13
13 -
 14
14 -
 15
15 -
 16
16 -
 17
17 -
 18
18 -
 19
19 -
 20
20 -
21
-
22
-
23
-
24
-
25
-
26
-
27
-
28
-
29
-
30
-
31
-
32
-
33
-
34
-
35
-
36
-
37
-
38
-
39
-
40
-
41
-
42
-
43
-
44
-
45
-
46
-
47
-
48
-
49
-
50
-
51
-
52
-
53
-
54
-
55
-
56
-
57
-
58
-
59
-
60
-
61
-
62
-
63
-
64
-
65
-
66
-
67
-
68
-
69
-
70
-
71
-
72
-
73
-
74
-
75
-
76
-
77
-
78
-
79
-
80
-
81
-
82
-
83
-
84
-
85
-
86
-
87
-
88
-
89
-
90
-
91
-
92
-
93
-
94
-
95
-
96
-
97
-
98
-
99
-
100
-
101
-
102
-
103
-
104
-
105
-
106
-
107
-
108
-
109
-
110
-
111
-
112
-
113
-
114
 |
 |

Nissan Annual Report 2004 7
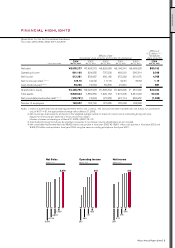
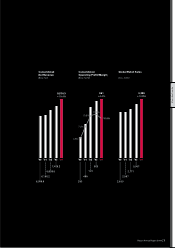
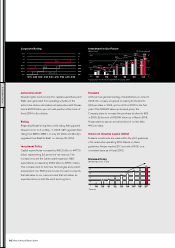
PERFORMANCE
6,089.6
6,196.2
6,828.6
7,429.2
8,576.3
+15.4%
2,633
2,597
2,771
3,057
3,388
+10.8%
290
489
737
825
861
+4.4%
’00 ’01 ’02 ’03 ’04 ’00 ’01 ’02 ’03 ’04 ’00 ’01 ’02 ’03 ’04
10.0%
10.8%
11.1%
7.9%
4.8%
Consolidated
Net Revenue
(Billion Yen)
Consolidated
Operating Profit/Margin
(Billion Yen/%)
Global Retail Sales
(Units: 1000s)