Nissan 2005 Annual Report Download - page 101
Download and view the complete annual report
Please find page 101 of the 2005 Nissan annual report below. You can navigate through the pages in the report by either clicking on the pages listed below, or by using the keyword search tool below to find specific information within the annual report.-
 1
1 -
2
-
3
-
4
-
5
-
6
-
7
-
8
-
9
-
10
-
11
-
12
-
13
-
14
-
15
-
16
-
17
-
18
-
19
-
20
-
21
-
22
-
23
-
24
-
25
-
26
-
27
-
28
-
29
-
30
-
31
-
32
-
33
-
34
-
35
-
36
-
37
-
38
-
39
-
40
-
41
-
42
-
43
-
44
-
45
-
46
-
47
-
48
-
49
-
50
-
51
-
52
-
53
-
54
-
55
-
56
-
57
-
58
-
59
-
60
-
61
-
62
-
63
-
64
-
65
-
66
-
67
-
68
-
69
-
70
-
71
-
72
-
73
-
74
-
75
-
76
-
77
-
78
-
79
-
80
-
81
-
82
-
83
-
84
-
85
-
86
-
87
-
88
-
89
-
90
-
 91
91 -
 92
92 -
 93
93 -
 94
94 -
 95
95 -
 96
96 -
 97
97 -
 98
98 -
 99
99 -
 100
100 -
 101
101 -
 102
102 -
 103
103 -
 104
104 -
 105
105 -
 106
106 -
 107
107 -
 108
108 -
 109
109 -
 110
110 -
 111
111 -
112
-
113
-
114
 |
 |

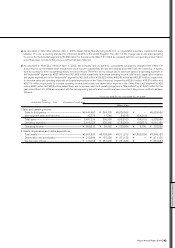
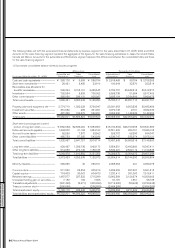
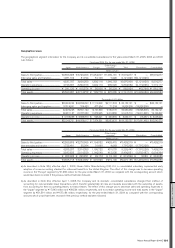
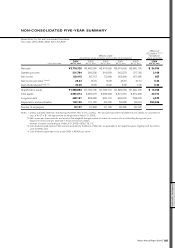
Millions of yen
Automobile and Sales Consolidated
Fiscal year 2003 (For the year ended Mar. 31, 2004) Eliminations Financing total
Operating activities
Income before income taxes and minority interests................................................................................................... ¥ 671,513 ¥ 64,984 ¥736,497
Depreciation and amortization...................................................................................................................................................... 313,146 147,891 461,037
Increase in finance receivables.................................................................................................................................................... (154) (462,956) (463,110)
Others ............................................................................................................................................................................................................... 57,936 5,057 62,993
Net cash provided by (used in) operating activities .................................................................................................... 1,042,441 (245,024) 797,417
Investing activities
Proceeds from sales of investment securities including shares of subsidiaries................................. 40,488 34 40,522
Proceeds from sales of property, plant and equipment........................................................................................... 53,827 105 53,932
Purchases of fixed assets................................................................................................................................................................ (422,326) (6,061) (428,387)
Purchases of leased vehicles........................................................................................................................................................ (19,295) (457,318) (476,613)
Proceeds from sales of leased vehicles............................................................................................................................... 20,857 170,248 191,105
Others ............................................................................................................................................................................................................... (101,534) (35,151) (136,685)
Net cash used in investing activities........................................................................................................................................ (427,983) (328,143) (756,126)
Financing activities
(Decrease) increase in short-term borrowings ............................................................................................................... (306,969) 169,394 (137,575)
(Decrease) increase in long-term borrowings................................................................................................................. (244,774) 371,473 126,699
Increase in bonds and debentures............................................................................................................................................ 120,000 30,000 150,000
Others ............................................................................................................................................................................................................... (253,031) 167 (252,864)
Net cash (used in) provided by financing activities..................................................................................................... (684,774) 571,034 (113,740)
Effect of exchange rate changes on cash and cash equivalents............................................................................. (2,095) (509) (2,604)
Decrease in cash and cash equivalents ........................................................................................................................................ (72,411) (2,642) (75,053)
Cash and cash equivalents at beginning of the year.......................................................................................................... 263,146 6,671 269,817
Increase due to inclusion in consolidation................................................................................................................................... 310 — 310
Decrease due to exclusion from consolidation........................................................................................................................ (910) — (910)
Cash and cash equivalents at end of the year ......................................................................................................................... ¥ 190,135 ¥ 4,029 ¥194,164
FINANCIAL SECTION
Nissan Annual Report 2004 99