Nissan 2005 Annual Report Download - page 96
Download and view the complete annual report
Please find page 96 of the 2005 Nissan annual report below. You can navigate through the pages in the report by either clicking on the pages listed below, or by using the keyword search tool below to find specific information within the annual report.
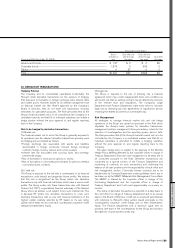
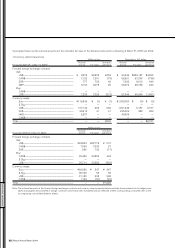
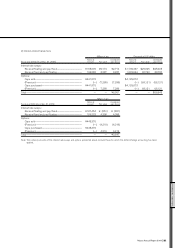
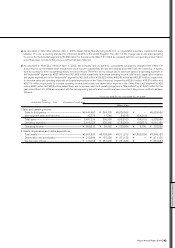
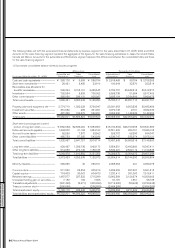
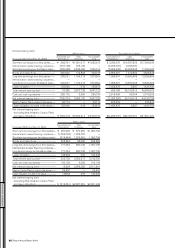
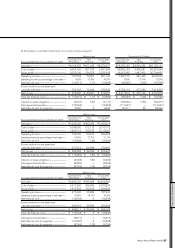
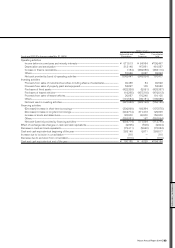
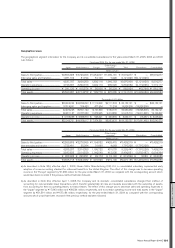
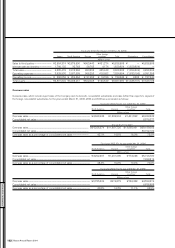
The following tables set forth the summarized financial statements by business segment for the years ended March 31, 2005, 2004 and 2003.
Amounts for the sales financing segment represent the aggregate of the figures for the sales financing subsidiaries in Japan, the United States,
Canada and Mexico. Amounts for the automobile and Eliminations segment represent the differences between the consolidated totals and those
for the sales financing segment.
1) Summarized consolidated balance sheets by business segment
Millions of yen Thousands of U.S. dollars
Automobile and Sales Consolidated Automobile and Sales Consolidated
Fiscal year 2004 (As of Mar. 31, 2005) Eliminations Financing total Eliminations Financing total
Cash and cash equivalents................................... ¥ 280,176 ¥ 9,608 ¥ 289,784 $ 2,618,468 $ 89,794 $ 2,708,262
Short-term investments........................................... 20,431 3,485 23,916 190,944 32,570 223,514
Receivables, less allowance for
doubtful receivables ................................................ 296,364 3,193,181 3,489,545 2,769,757 29,842,813 32,612,570
Inventories.......................................................................... 702,534 5,528 708,062 6,565,738 51,664 6,617,402
Other current assets .................................................. 388,956 239,131 628,087 3,635,104 2,234,869 5,869,973
Total current assets.................................................... 1,688,461 3,450,933 5,139,394 15,780,011 32,251,710 48,031,721
Property, plant and equipment, net ................ 2,774,719 1,022,228 3,796,947 25,931,953 9,553,533 35,485,486
Investment securities................................................. 361,632 289 361,921 3,379,738 2,701 3,382,439
Other assets...................................................................... 427,389 122,872 550,261 3,994,290 1,148,336 5,142,626
Total assets ....................................................................... ¥5,252,201 ¥4,596,322 ¥9,848,523 $49,085,992 $42,956,280 $92,042,272
Short-term borrowings and current
portion of long-term debt.................................... ¥ (552,052) ¥2,536,002 ¥1,983,950 $ (5,159,364) $23,700,953 $18,541,589
Notes and accounts payable............................... 1,343,000 41,163 1,384,163 12,551,402 384,701 12,936,103
Accrued income taxes.............................................. 56,256 7,307 63,563 525,757 68,290 594,047
Other current liabilities............................................. 485,753 57,285 543,038 4,539,747 535,374 5,075,121
Total current liabilities............................................... 1,332,957 2,641,757 3,974,714 12,457,542 24,689,318 37,146,860
Long-term debt .............................................................. 626,437 1,336,736 1,963,173 5,854,551 12,492,860 18,347,411
Other long-term liabilities....................................... 914,039 274,146 1,188,185 8,542,421 2,562,112 11,104,533
Total long-term liabilities......................................... 1,540,476 1,610,882 3,151,358 14,396,972 15,054,972 29,451,944
Total liabilities.................................................................. 2,873,433 4,252,639 7,126,072 26,854,514 39,744,290 66,598,804
Minority interests........................................................... 256,656 45 256,701 2,398,654 421 2,399,075
Common stock................................................................ 517,260 88,554 605,814 4,834,206 827,607 5,661,813
Capital surplus................................................................. 774,403 30,067 804,470 7,237,411 281,000 7,518,411
Retained earnings........................................................ 1,487,577 227,522 1,715,099 13,902,589 2,126,374 16,028,963
Unrealized holding gain on securities.......... 7,189 166 7,355 67,187 1,551 68,738
Translation adjustments.......................................... (397,428) (2,671) (400,099) (3,714,280) (24,963) (3,739,243)
Treasury common stock.......................................... (266,889) — (266,889) (2,494,289) — (2,494,289)
Total shareholders’ equity...................................... 2,122,112 343,638 2,465,750 19,832,824 3,211,569 23,044,393
Total liabilities and shareholders’ equity .... ¥5,252,201 ¥4,596,322 ¥9,848,523 $49,085,992 $42,956,280 $92,042,272
FINANCIAL SECTION
Nissan Annual Report 2004
94


