Nissan 2005 Annual Report Download - page 81
Download and view the complete annual report
Please find page 81 of the 2005 Nissan annual report below. You can navigate through the pages in the report by either clicking on the pages listed below, or by using the keyword search tool below to find specific information within the annual report.-
 1
1 -
2
-
3
-
4
-
5
-
6
-
7
-
8
-
9
-
10
-
11
-
12
-
13
-
14
-
15
-
16
-
17
-
18
-
19
-
20
-
21
-
22
-
23
-
24
-
25
-
26
-
27
-
28
-
29
-
30
-
31
-
32
-
33
-
34
-
35
-
36
-
37
-
38
-
39
-
40
-
41
-
42
-
43
-
44
-
45
-
46
-
47
-
48
-
49
-
50
-
51
-
52
-
53
-
54
-
55
-
56
-
57
-
58
-
59
-
60
-
61
-
62
-
63
-
64
-
65
-
66
-
67
-
68
-
69
-
70
-
 71
71 -
 72
72 -
 73
73 -
 74
74 -
 75
75 -
 76
76 -
 77
77 -
 78
78 -
 79
79 -
 80
80 -
 81
81 -
 82
82 -
 83
83 -
 84
84 -
 85
85 -
 86
86 -
 87
87 -
 88
88 -
 89
89 -
 90
90 -
 91
91 -
92
-
93
-
94
-
95
-
96
-
97
-
98
-
99
-
100
-
101
-
102
-
103
-
104
-
105
-
106
-
107
-
108
-
109
-
110
-
111
-
112
-
113
-
114
 |
 |
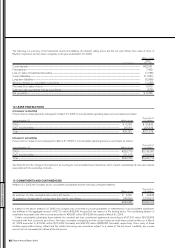
(e) The effect of this change was to increase cost of sales by
¥112,074 million ($1,047,421 thousand) and to decrease gross
profit and selling, general and administrative expenses by the same
amount for the year ended March 31, 2005. This change had no
impact on operating income, income before income taxes and minori-
ty income and net income for the years ended March 31, 2005 as
compared with the corresponding amounts which would have been
recorded if the previous method had been followed. This change had
no effect on segment information.
FINANCIAL SECTION
Nissan Annual Report 2004 79
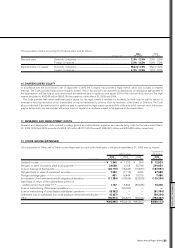
3. U.S. DOLLAR AMOUNTS
Amounts in U.S. dollars are included solely for the convenience of the reader. The rate of ¥107 = US$1.00, the approximate rate of exchange in
effect on March 31, 2005, has been used. The inclusion of such amounts is not intended to imply that yen amounts have been or could be readily
converted, realized or settled in U.S. dollars at that or any other rate.
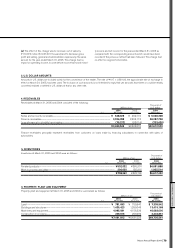
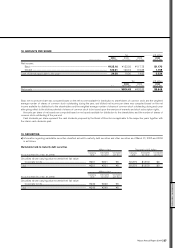
4. RECEIVABLES
Receivables at March 31, 2005 and 2004 consisted of the following:
Thousands of
Millions of yen U.S. dollars
2004 2003 2004
As of Mar. 31, 2005 Mar. 31, 2004 Mar. 31, 2005
Notes and accounts receivable......................................................................................................................................... ¥ 538,029 ¥ 462,716 $ 5,028,308
Finance receivables.................................................................................................................................................................... 3,026,788 2,203,174 28,287,738
Less allowance for doubtful receivables................................................................................................................... (75,272) (63,014) (703,476)
..................................................................................................................................................................................................................... ¥3,489,545 ¥2,602,876 $32,612,570
Finance receivables principally represent receivables from customers on loans made by financing subsidiaries in connection with sales of
automobiles.
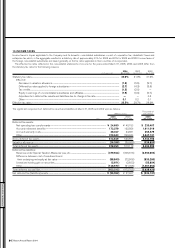
5. INVENTORIES
Inventories at March 31, 2005 and 2004 were as follows:
Thousands of
Millions of yen U.S. dollars
2004 2003 2004
As of Mar. 31, 2005 Mar. 31, 2004 Mar. 31, 2005
Finished products................................................................................................................................................................................... ¥502,032 ¥386,874 $4,691,888
Work in process and other.............................................................................................................................................................. 206,030 155,918 1,925,514
............................................................................................................................................................................................................................... ¥708,062 ¥542,792 $6,617,402
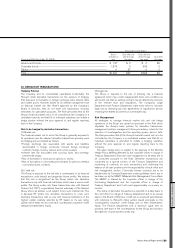
6. PROPERTY, PLANT AND EQUIPMENT
Property, plant and equipment at March 31, 2005 and 2004 is summarized as follows:
Thousands of
Millions of yen U.S. dollars
2004 2003 2004
As of Mar. 31, 2005 Mar. 31, 2004 Mar. 31, 2005
Land......................................................................................................................................................................................................... ¥ 781,693 ¥ 759,640 $ 7,305,542
Buildings and structures......................................................................................................................................................... 1,435,423 1,259,048 13,415,168
Machinery and equipment..................................................................................................................................................... 4,995,081 4,158,336 46,683,000
Construction in progress........................................................................................................................................................ 249,615 253,999 2,332,851
¥7,461,812 ¥6,431,023 $69,736,561