Nissan 2005 Annual Report Download - page 48
Download and view the complete annual report
Please find page 48 of the 2005 Nissan annual report below. You can navigate through the pages in the report by either clicking on the pages listed below, or by using the keyword search tool below to find specific information within the annual report.-
 1
1 -
2
-
3
-
4
-
5
-
6
-
7
-
8
-
9
-
10
-
11
-
12
-
13
-
14
-
15
-
16
-
17
-
18
-
19
-
20
-
21
-
22
-
23
-
24
-
25
-
26
-
27
-
28
-
29
-
30
-
31
-
32
-
33
-
34
-
35
-
36
-
37
-
 38
38 -
 39
39 -
 40
40 -
 41
41 -
 42
42 -
 43
43 -
 44
44 -
 45
45 -
 46
46 -
 47
47 -
 48
48 -
 49
49 -
 50
50 -
 51
51 -
 52
52 -
 53
53 -
 54
54 -
 55
55 -
 56
56 -
 57
57 -
 58
58 -
59
-
60
-
61
-
62
-
63
-
64
-
65
-
66
-
67
-
68
-
69
-
70
-
71
-
72
-
73
-
74
-
75
-
76
-
77
-
78
-
79
-
80
-
81
-
82
-
83
-
84
-
85
-
86
-
87
-
88
-
89
-
90
-
91
-
92
-
93
-
94
-
95
-
96
-
97
-
98
-
99
-
100
-
101
-
102
-
103
-
104
-
105
-
106
-
107
-
108
-
109
-
110
-
111
-
112
-
113
-
114
 |
 |
Nissan Annual Report 2004
46
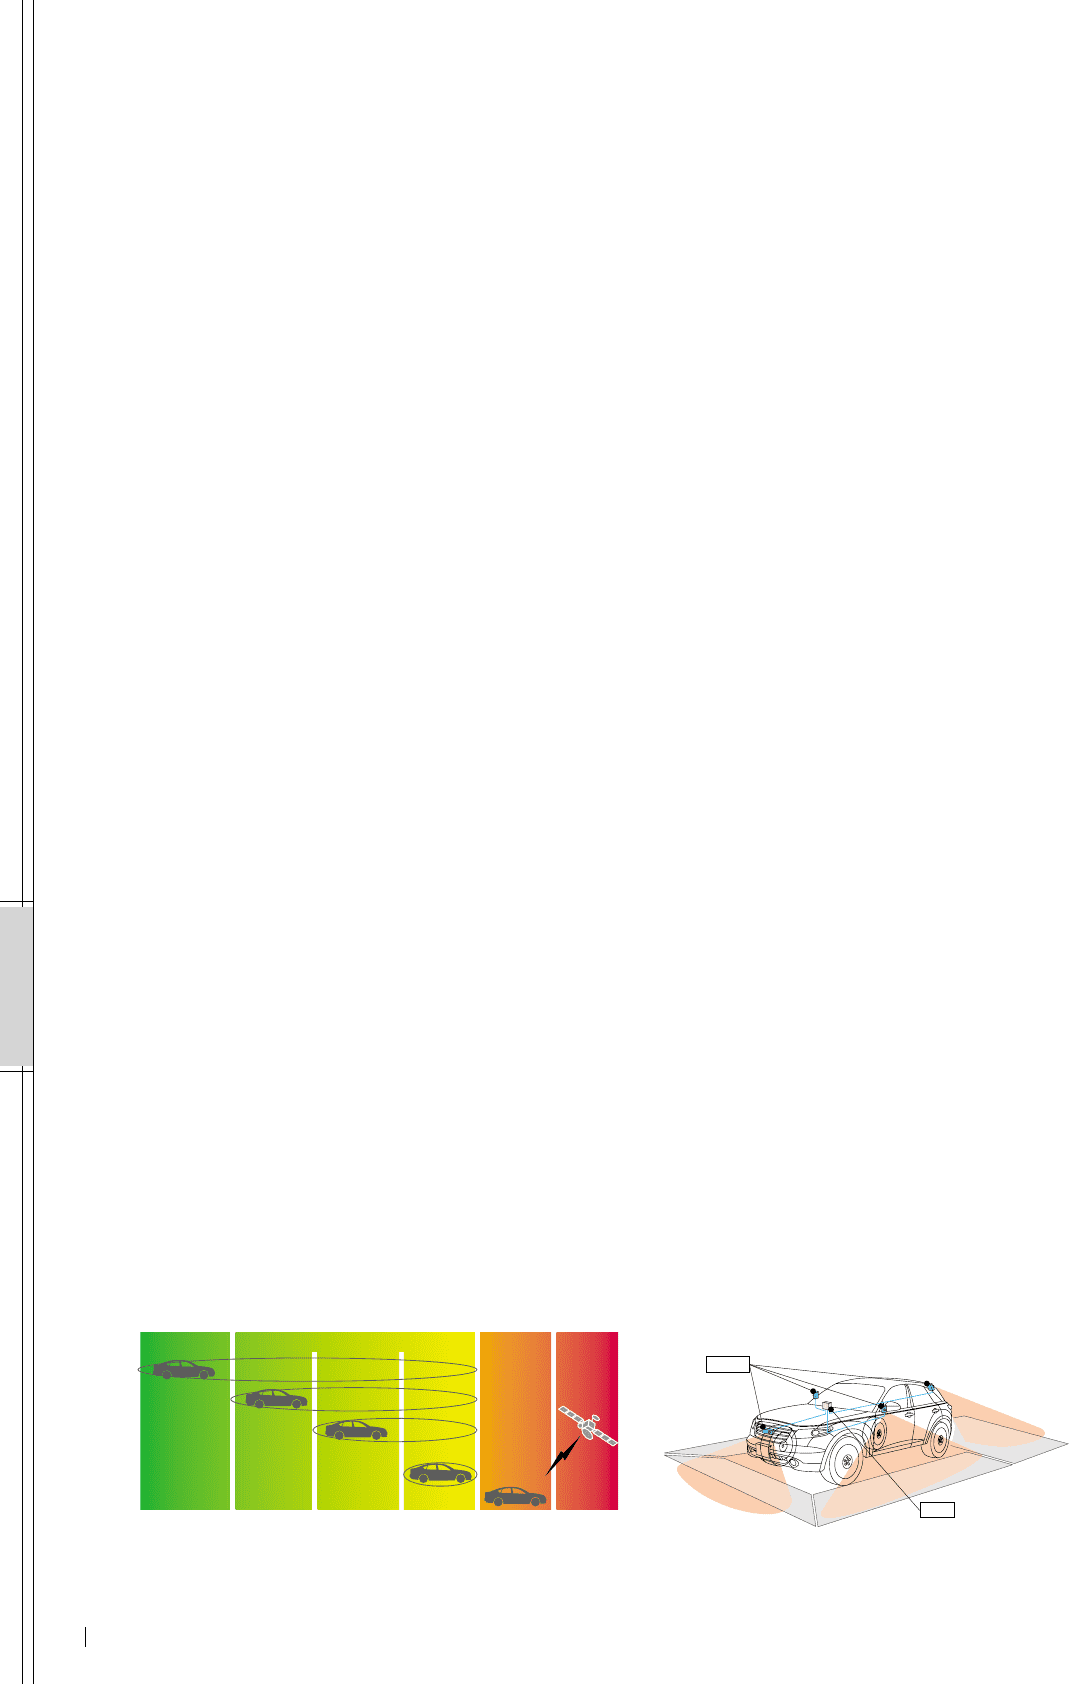
OUR WORK
Helps maintain safe driving
Risk has not yet
appeared Risk has
appeared Crash may
occur Crash is
unavoidable Crash Post
crash
Helps correct to safer condition
Intervenes to
safer condition
Prepares for
crash Helps
Mitigate
crash injury Helps
mitigate
post-crash
injury
Normal Driving Risk Accident Post
Accident
Cameras
Display
Safety Shield—concept image Around View Monitor
Safety
In the area of safety, we have established Vision Zero, the
goal of which is to reduce the number of fatal accidents to
zero. As a reference point, we are using the number of
such accidents in 1995 that involved Nissan vehicles. We
realize that accidents cannot be completely avoided, so our
objective is to be substantially zero in the future. To achieve
this, we have set a series of milestones, including cutting
the 1995 fatal accident figure in half by 2015.
Interestingly, while the number of fatal ones is
decreasing, the number of all accidents in Japan is
increasing. Our first goal is to decrease the overall accident
count, which should further reduce the number of fatalities.
Several factors contribute to accidents, including driver
inexperience and higher speeds. Based on these factors,
we came up with the approach of Safety Shield. Safety
Shield establishes a timeline for the entire accident,
covering the safe driving zone, the moment before the
accident, the actual crash, the response time by authorities,
and the time taken for post-accident rescue.
In the past, safety technology primarily focused on
dealing with damage in and around the vehicle, such as
airbags, body structure design, seatbelts and crumple
zones. Now we are studying normal driving conditions and
researching how we can keep car and driver in the safe
driving zone. In cases where the driving environment
becomes unsafe, some type of warning would usually help
the driver to return to the safe driving zone. A driver actually
in danger has probably lost control of the car. In the latter
cases, we must focus on safety technologies that prompt
the vehicle itself to automatically assist the driver. An
example of this is Nissan’s Lane Departure Prevention
system or brake assist: When the vehicle approaches the
lane markers, this system not only warns the driver to pay
attention through a display and an audible buzzer, it also
generates part of the necessary yaw movement needed to
return the vehicle to its lane and safety.
Another Nissan safety innovation is the Around
View Monitor. This system offers a 360-degree view on
a dashboard display of what is around the vehicle. In
addition to significantly reducing the blind spots in driving,
the Around View Monitor is helpful when parking, since
it improves the driver’s field of vision and enables
better maneuverability.
In developing safety technologies, we also look at the
conditions that exist seconds before an unavoidable crash.
With this information, we can provide technologies to
minimize the impact and damage in addition to notifying the
authorities and calling for assistance afterward. Because
we are building on actual accident data, the final stage in
the Safety Shield involves collecting and analyzing the data
and feeding what we learn back into the development
process. We have committed ourselves to introducing over
ten new safety technologies during the next three years,
spanning the entire driving range from the safe driving
zone to the actual crash.
For more on safety at Nissan, please see the 2005 Nissan
Sustainability Report