Nissan 2005 Annual Report Download - page 94
Download and view the complete annual report
Please find page 94 of the 2005 Nissan annual report below. You can navigate through the pages in the report by either clicking on the pages listed below, or by using the keyword search tool below to find specific information within the annual report.-
 1
1 -
2
-
3
-
4
-
5
-
6
-
7
-
8
-
9
-
10
-
11
-
12
-
13
-
14
-
15
-
16
-
17
-
18
-
19
-
20
-
21
-
22
-
23
-
24
-
25
-
26
-
27
-
28
-
29
-
30
-
31
-
32
-
33
-
34
-
35
-
36
-
37
-
38
-
39
-
40
-
41
-
42
-
43
-
44
-
45
-
46
-
47
-
48
-
49
-
50
-
51
-
52
-
53
-
54
-
55
-
56
-
57
-
58
-
59
-
60
-
61
-
62
-
63
-
64
-
65
-
66
-
67
-
68
-
69
-
70
-
71
-
72
-
73
-
74
-
75
-
76
-
77
-
78
-
79
-
80
-
81
-
82
-
83
-
 84
84 -
 85
85 -
 86
86 -
 87
87 -
 88
88 -
 89
89 -
 90
90 -
 91
91 -
 92
92 -
 93
93 -
 94
94 -
 95
95 -
 96
96 -
 97
97 -
 98
98 -
 99
99 -
 100
100 -
 101
101 -
 102
102 -
 103
103 -
 104
104 -
105
-
106
-
107
-
108
-
109
-
110
-
111
-
112
-
113
-
114
 |
 |

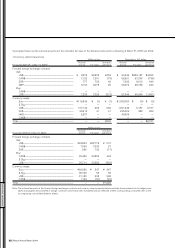
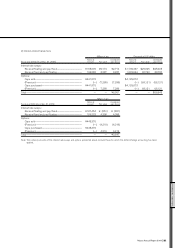
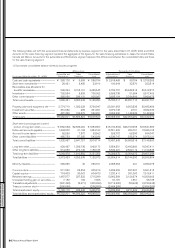
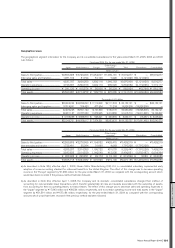
Business segments
The business segment information for the Company and its consolidated subsidiaries for the years ended March 31, 2005, 2004 and 2003 is as
follows:
Fiscal year 2004 (For the year ended Mar. 31, 2005)
Sales
Automobile Financing Total Eliminations Consolidated
Millions of yen
I. Sales and operating income
Sales to third parties............................................................................... ¥8,177,841 ¥ 398,436 ¥ 8,576,277 ¥ — ¥8,576,277
Inter-segment sales and transfers............................................... 23,742 13,509 37,251 (37,251) —
Total sales........................................................................................................ 8,201,583 411,945 8,613,528 (37,251) 8,576,277
Operating expenses................................................................................ 7,429,760 338,388 7,768,148 (53,031) 7,715,117
Operating income...................................................................................... ¥ 771,823 ¥ 73,557 ¥ 845,380 ¥ 15,780 ¥ 861,160
II. Assets, depreciation and capital expenditures
Total assets .................................................................................................... ¥6,646,594 ¥4,596,322 ¥11,242,916 ¥(1,394,393) ¥9,848,523
Depreciation and amortization........................................................ ¥ 349,163 ¥ 176,763 ¥ 525,926 ¥ — ¥ 525,926
Capital expenditures............................................................................... ¥ 469,283 ¥ 582,468 ¥ 1,051,751 ¥ — ¥1,051,751
Fiscal year 2004 (For the year ended Mar. 31, 2005)
Sales
Automobile Financing Total Eliminations Consolidated
Thousands of U.S. dollars
I. Sales and operating income
Sales to third parties............................................................. $76,428,421 $ 3,723,700 $ 80,152,121 $ — $80,152,121
Inter-segment sales and transfers............................. 221,889 126,253 348,142 (348,142) —
Total sales...................................................................................... 76,650,310 3,849,953 80,500,263 (348,142) 80,152,121
Operating expenses.............................................................. 69,437,010 3,162,504 72,599,514 (495,617) 72,103,897
Operating income.................................................................... $ 7,213,300 $ 687,449 $ 7,900,749 $ 147,475 $ 8,048,224
II. Assets, depreciation and capital expenditures
Total assets .................................................................................. $62,117,701 $42,956,281 $105,073,982 $(13,031,710) $92,042,272
Depreciation and amortization...................................... $ 3,263,206 $ 1,651,990 $ 4,915,196 $ — $ 4,915,196
Capital expenditures............................................................. $ 4,385,823 $ 5,443,626 $ 9,829,449 $ — $ 9,829,449
Fiscal year 2003 (For the year ended Mar. 31, 2004)
Sales
Automobile Financing Total Eliminations Consolidated
Millions of yen
I. Sales and operating income
Sales to third parties................................................................................... ¥7,072,982 ¥ 356,237 ¥7,429,219 ¥ — ¥7,429,219
Inter-segment sales and transfers................................................... 22,916 9,752 32,668 (32,668) —
Total sales............................................................................................................ 7,095,898 365,989 7,461,887 (32,668) 7,429,219
Operating expenses.................................................................................... 6,340,631 301,179 6,641,810 (37,446) 6,604,364
Operating income.......................................................................................... ¥ 755,267 ¥ 64,810 ¥ 820,077 ¥ 4,778 ¥ 824,855
II. Assets, depreciation and capital expenditures
Total assets ........................................................................................................ ¥5,847,139 ¥3,479,171 ¥9,326,310 ¥(1,466,454) ¥7,859,856
Depreciation and amortization............................................................ ¥ 313,289 ¥ 147,748 ¥ 461,037 ¥ — ¥ 461,037
Capital expenditures................................................................................... ¥ 441,384 ¥ 463,616 ¥ 905,000 ¥ — ¥ 905,000
FINANCIAL SECTION
Nissan Annual Report 2004
92
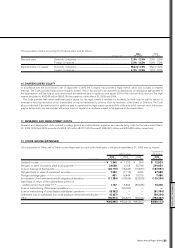
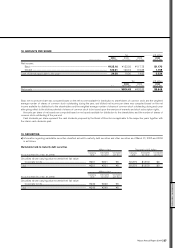
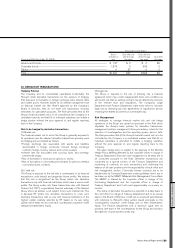
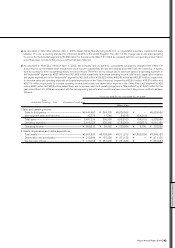
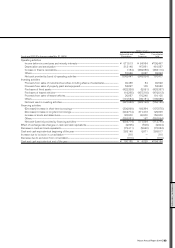
21. SEGMENT INFORMATION
The Company and its consolidated subsidiaries are primarily engaged in the manufacture and sales of products in the automobile segment and in
providing various financial services to users of the Company’s products in the sales financing segment. These products, which are sold in Japan
and overseas, principally in North America and Europe, include passenger cars, buses and trucks as well as the related components. Financial
services include primarily leases and credits principally in Japan and North America.