Nissan 2005 Annual Report Download - page 103
Download and view the complete annual report
Please find page 103 of the 2005 Nissan annual report below. You can navigate through the pages in the report by either clicking on the pages listed below, or by using the keyword search tool below to find specific information within the annual report.-
 1
1 -
2
-
3
-
4
-
5
-
6
-
7
-
8
-
9
-
10
-
11
-
12
-
13
-
14
-
15
-
16
-
17
-
18
-
19
-
20
-
21
-
22
-
23
-
24
-
25
-
26
-
27
-
28
-
29
-
30
-
31
-
32
-
33
-
34
-
35
-
36
-
37
-
38
-
39
-
40
-
41
-
42
-
43
-
44
-
45
-
46
-
47
-
48
-
49
-
50
-
51
-
52
-
53
-
54
-
55
-
56
-
57
-
58
-
59
-
60
-
61
-
62
-
63
-
64
-
65
-
66
-
67
-
68
-
69
-
70
-
71
-
72
-
73
-
74
-
75
-
76
-
77
-
78
-
79
-
80
-
81
-
82
-
83
-
84
-
85
-
86
-
87
-
88
-
89
-
90
-
91
-
92
-
 93
93 -
 94
94 -
 95
95 -
 96
96 -
 97
97 -
 98
98 -
 99
99 -
 100
100 -
 101
101 -
 102
102 -
 103
103 -
 104
104 -
 105
105 -
 106
106 -
 107
107 -
 108
108 -
 109
109 -
 110
110 -
 111
111 -
 112
112 -
 113
113 -
114
 |
 |

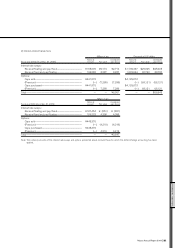
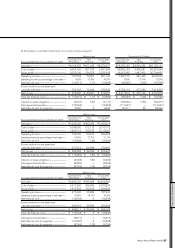
Geographical areas
The geographical segment information for the Company and its consolidated subsidiaries for the years ended March 31, 2005, 2004 and 2003
is as follows:
Fiscal year 2004 (For the year ended Mar. 31, 2005)
Other foreign
Japan North America Europe countries Total Eliminations Consolidated
Millions of yen
Sales to third parties.......................................... ¥2,556,683 ¥3,726,456 ¥1,254,007 ¥1,039,131 ¥ 8,576,277 ¥ — ¥8,576,277
Inter-area sales and transfers .................... 1,981,104 81,794 51,109 7,622 2,121,629 ¥(2,121,629) —
Total sales................................................................... 4,537,787 3,808,250 1,305,116 1,046,753 10,697,906 (2,121,629) 8,576,277
Operating expenses........................................... 4,196,667 3,392,676 1,249,110 996,529 9,834,982 (2,119,865) 7,715,117
Operating income................................................. ¥ 341,120 ¥ 415,574 ¥ 56,006 ¥ 50,224 ¥ 862,924 ¥(1,764) ¥ 861,160
Total assets ............................................................... ¥5,590,397 ¥4,714,272 ¥ 799,778 ¥ 637,065 ¥11,741,512 ¥(1,892,989) ¥9,848,523
Thousands of U.S. dollars
Sales to third parties..........................................
$23,894,234 $34,826,692 $11,719,692 $9,711,503 $ 80,152,121 $ — $80,152,121
Inter-area sales and transfers ....................
18,514,991 764,430 477,654 71,234 19,828,309 (19,828,309) —
Total sales...................................................................
42,409,225 35,591,122 12,197,346 9,782,737 99,980,430 (19,828,309) 80,152,121
Operating expenses...........................................
39,221,187 31,707,252 11,673,925 9,313,355 91,915,719 (19,811,822) 72,103,897
Operating income.................................................
$ 3,188,038 $ 3,883,870 $ 523,421 $ 469,382 $ 8,064,711 $ (16,487) $ 8,048,224
Total assets ...............................................................
$52,246,701 $44,058,617 $ 7,474,561 $5,953,878 $109,733,757 $(17,691,485) $92,042,272
Fiscal year 2003 (For the year ended Mar. 31, 2004)
Other foreign
Japan North America Europe countries Total Eliminations Consolidated
Millions of yen
Sales to third parties.......................................... ¥2,559,806 ¥3,278,966 ¥1,164,032 ¥426,415 ¥7,429,219 ¥ — ¥7,429,219
Inter-area sales and transfers
.............................. 1,725,491 35,384 31,690 4,663 1,797,228 (1,797,228) —
Total sales................................................................... 4,285,297 3,314,350 1,195,722 431,078 9,226,447 (1,797,228) 7,429,219
Operating expenses........................................... 3,932,835 2,914,529 1,146,549 412,938 8,406,851 (1,802,487) 6,604,364
Operating income................................................. ¥ 352,462 ¥ 399,821 ¥ 49,173 ¥ 18,140 ¥ 819,596 ¥ 5,259 ¥ 824,855
Total assets ............................................................... ¥4,805,718 ¥3,664,382 ¥ 607,926 ¥219,109 ¥9,297,135 ¥(1,437,279) ¥7,859,856
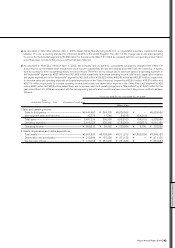
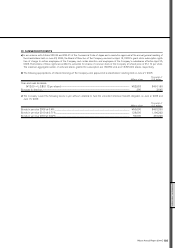
a) As described in Note 2(b), effective April 1, 2003, Nissan Motor Manufacturing (UK) Ltd., a consolidated subsidiary, implemented early
adoption of a new accounting standard for retirement benefits in the United Kingdom. The effect of this change was to decrease operating
income in the “Europe” segment by ¥1,686 million for the year ended March 31, 2004 as compared with the corresponding amount which
would have been recorded if the previous method had been followed.
b) As described in Note 2(c), effective April 1, 2003, the Company and its domestic consolidated subsidiaries changed their method of
accounting for noncancelable lease transactions which transfer substantially all risks and rewards associated with the ownership of assets,
from accounting for them as operating leases, to finance leases. The effect of this change was to decrease sales and operating expenses in
the “Japan” segment by ¥17,943 million and ¥39,534 million, respectively, and to increase operating income and total assets in the “Japan”
segment by ¥21,591 million and ¥137,184 million, respectively, for the year ended March 31, 2004 as compared with the corresponding
amounts which would have been recorded if the previous method had been followed.
FINANCIAL SECTION
Nissan Annual Report 2004 101