Nissan 2005 Annual Report Download - page 78
Download and view the complete annual report
Please find page 78 of the 2005 Nissan annual report below. You can navigate through the pages in the report by either clicking on the pages listed below, or by using the keyword search tool below to find specific information within the annual report.-
 1
1 -
2
-
3
-
4
-
5
-
6
-
7
-
8
-
9
-
10
-
11
-
12
-
13
-
14
-
15
-
16
-
17
-
18
-
19
-
20
-
21
-
22
-
23
-
24
-
25
-
26
-
27
-
28
-
29
-
30
-
31
-
32
-
33
-
34
-
35
-
36
-
37
-
38
-
39
-
40
-
41
-
42
-
43
-
44
-
45
-
46
-
47
-
48
-
49
-
50
-
51
-
52
-
53
-
54
-
55
-
56
-
57
-
58
-
59
-
60
-
61
-
62
-
63
-
64
-
65
-
66
-
67
-
 68
68 -
 69
69 -
 70
70 -
 71
71 -
 72
72 -
 73
73 -
 74
74 -
 75
75 -
 76
76 -
 77
77 -
 78
78 -
 79
79 -
 80
80 -
 81
81 -
 82
82 -
 83
83 -
 84
84 -
 85
85 -
 86
86 -
 87
87 -
 88
88 -
89
-
90
-
91
-
92
-
93
-
94
-
95
-
96
-
97
-
98
-
99
-
100
-
101
-
102
-
103
-
104
-
105
-
106
-
107
-
108
-
109
-
110
-
111
-
112
-
113
-
114
 |
 |
Thousands of
Millions of yen U.S. dollars (Note 3)
2004 2003 2002 2004
For the years ended Mar. 31, 2005 Mar. 31, 2004 Mar. 31, 2003 Mar. 31, 2005
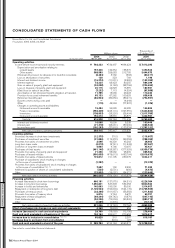
Operating activities
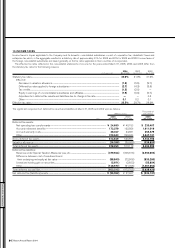
Income before income taxes and minority interests ¥ 793,233 ¥736,497 ¥694,624 $ 7,413,393
Depreciation and amortization relating to:
Leased assets 157,346 134,354 158,370 1,470,523
Other assets 368,580 326,683 212,755 3,444,673
(Reversal of) provision for allowance for doubtful receivables (6,464) 3,732 (503) (60,411)
Loss on devaluation of securities 128 323 769 1,196
Interest and dividend income (16,274) (11,591) (8,520) (152,093)
Interest expense 73,220 63,423 80,255 684,299
Gain on sales of property, plant and equipment (24,038) (4,163) (58,796) (224,654)
Loss on disposal of property, plant and equipment 20,115 24,823 15,587 187,991
(Gain) loss on sales of securities (7,232) 7,113 (4,324) (67,589)
Amortization of net retirement benefit obligation at transition 11,795 13,936 23,923 110,234
Provision for accrued retirement benefits 65,103 67,262 100,629 608,439
Retirement benefits paid (82,924) (80,650) (86,917) (774,991)
Business restructuring costs paid —— (4,644) —
Other (115) 45,934 (77,897) (1,076)
Changes in operating assets and liabilities:
Notes and accounts receivable 15,494 24,539 44,989 144,804
Finance receivables (794,349) (463,110) (327,357) (7,423,822)
Inventories (108,903) (28,220) (28,404) (1,017,785)
Notes and accounts payable 152,213 68,879 36,877 1,422,551
Subtotal 616,928 929,764 771,416 5,765,682
Interest and dividends received 16,098 10,699 8,238 150,449
Interest paid (71,318) (65,231) (80,902) (666,523)
Income taxes paid (192,293) (77,815) (123,374) (1,797,131)
Net cash provided by operating activities 369,415 797,417 575,378 3,452,477
Investing activities
(Increase) decrease in short-term investments (12,370) (710) 789 (115,607)
Purchases of investment securities (31,896) (119,372) (32,053) (298,093)
Proceeds from sales of investment securities 3,098 40,330 45,263 28,953
Long-term loans made (4,019) (3,741) (11,343) (37,561)
Collection of long-term loans receivable 4,860 4,766 13,097 45,421
Purchases of fixed assets (461,146) (428,387) (377,929) (4,309,776)
Proceeds from sales of property, plant and equipment 71,256 53,932 98,699 665,944
Purchases of leased vehicles (590,605) (476,613) (483,704) (5,519,673)
Proceeds from sales of leased vehicles 173,812 191,105 259,075 1,624,411
Purchase of subsidiaries’ stock resulting in changes
in the scope of consolidation (1,292) —— (12,075)
Proceeds from sales of subsidiaries’ stock resulting in changes
in the scope of consolidation (Note 15) 7,697 192 8,395 71,935
Additional acquisition of shares of consolidated subsidiaries (500) (2,531) (692) (4,673)
Other (23,930) (15,097) (34,971) (223,645)
Net cash used in investing activities (865,035) (756,126) (515,374) (8,084,439)
Financing activities
Increase (decrease) in short-term borrowings 666,191 (137,575) (54,310) 6,226,084
Increase in long-term borrowings 1,050,841 847,393 534,053 9,820,944
Increase in bonds and debentures 140,663 150,000 85,000 1,314,607
Repayment or redemption of long-term debt (1,145,534) (720,694) (524,115) (10,705,925)
Purchases of treasury stock (33,366) (101,957) (58,383) (311,832)
Proceeds from sales of treasury stock 6,816 9,744 5,670 63,701
Repayment of lease obligations (69,244) (84,742) (9,879) (647,140)
Cash dividends paid (94,236) (74,594) (50,800) (880,710)
Other (1,085) (1,315) — (10,140)
Net cash provided by (used in) financing activities 521,046 (113,740) (72,764) 4,869,589
Effect of exchange rate changes on cash and cash equivalents 4,369 (2,604) 654 40,831
Increase (decrease) in cash and cash equivalents 29,795 (75,053) (12,106) 278,458
Cash and cash equivalents at beginning of the year 194,164 269,817 279,653 1,814,617
Increase due to inclusion in consolidation (Note 15) 65,825 310 2,297 615,187
Decrease due to exclusion from consolidation — (910) (27) —
Cash and cash equivalents at end of the year ¥ 289,784 ¥194,164 ¥269,817 $ 2,708,262
See notes to consolidated financial statements.
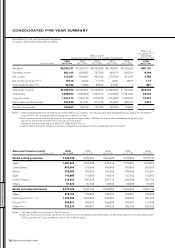
CONSOLIDATED STATEMENTS OF CASH FLOWS
Nissan Motor Co., Ltd. and Consolidated Subsidiaries
Fiscal years 2004, 2003 and 2002
FINANCIAL SECTION
Nissan Annual Report 2004
76