Nissan 2005 Annual Report Download - page 3
Download and view the complete annual report
Please find page 3 of the 2005 Nissan annual report below. You can navigate through the pages in the report by either clicking on the pages listed below, or by using the keyword search tool below to find specific information within the annual report.-
 1
1 -
 2
2 -
 3
3 -
 4
4 -
 5
5 -
 6
6 -
 7
7 -
 8
8 -
 9
9 -
 10
10 -
 11
11 -
 12
12 -
 13
13 -
 14
14 -
15
-
16
-
17
-
18
-
19
-
20
-
21
-
22
-
23
-
24
-
25
-
26
-
27
-
28
-
29
-
30
-
31
-
32
-
33
-
34
-
35
-
36
-
37
-
38
-
39
-
40
-
41
-
42
-
43
-
44
-
45
-
46
-
47
-
48
-
49
-
50
-
51
-
52
-
53
-
54
-
55
-
56
-
57
-
58
-
59
-
60
-
61
-
62
-
63
-
64
-
65
-
66
-
67
-
68
-
69
-
70
-
71
-
72
-
73
-
74
-
75
-
76
-
77
-
78
-
79
-
80
-
81
-
82
-
83
-
84
-
85
-
86
-
87
-
88
-
89
-
90
-
91
-
92
-
93
-
94
-
95
-
96
-
97
-
98
-
99
-
100
-
101
-
102
-
103
-
104
-
105
-
106
-
107
-
108
-
109
-
110
-
111
-
112
-
113
-
114
 |
 |
Nissan Annual Report 2004 1
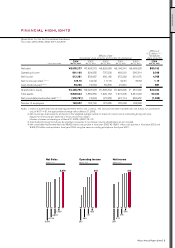
HIGHLIGHTS
Millions of
U.S. dollars (Note 1)
Millions of yen (except per
(except per share amounts and number of employees) share amounts)
2004 2003 2002 2001 2000 2004
For the years ended Mar. 31, 2005 Mar. 31, 2004 Mar. 31, 2003 Mar. 31, 2002 Mar. 31, 2001 Mar. 31, 2005
Net sales ¥8,576,277 ¥7,429,219 ¥6,828,588 ¥6,196,241 ¥6,089,620 $80,152
Operating income 861,160 824,855 737,230 489,215 290,314 8,048
Net income 512,281 503,667 495,165 372,262 331,075 4,788
Net income per share (Note 2) 125.16 122.02 117.75 92.61 83.53 1.17
Cash dividends paid (Note 3) 94,236 74,594 50,800 27,841 0 881
Shareholder’s equity ¥2,465,750 ¥2,023,994 ¥1,808,304 ¥1,620,822 ¥ 957,939 $23,044
Total assets 9,848,523 7,859,856 7,349,183 7,215,005 6,451,243 92,042
Net consolidated automotive debt (Note 4) (205,791) 13,603 107,952 431,714 952,657 (1,923)
Number of employees 183,607 123,748 127,625 125,099 133,833
Notes: 1. Unless indicated otherwise, all dollar figures herein refer to U.S. currency. Yen amounts have been translated into U.S. dollars, for convenience
only, at ¥107 = $1, the approximate exchange rate on March 31, 2005.
2. Net income per share amounts are based on the weighted average number of shares of common stock outstanding during each year.
Figures for net income per share are in exact yen and U.S. dollars.
Number of shares outstanding as of March 31, 2005: 4,520,715,112.
3. Cash dividends during the full year by subsidiary companies to non-Nissan minority shareholders are not included.
4. Net consolidated automotive debt was ¥8,602 million cash positive in fiscal year 2002, ¥215,861 million cash positive in fiscal year 2003, and
¥453,470 million cash positive in fiscal year 2004, using the same accounting principles as fiscal year 2001.
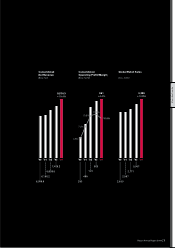
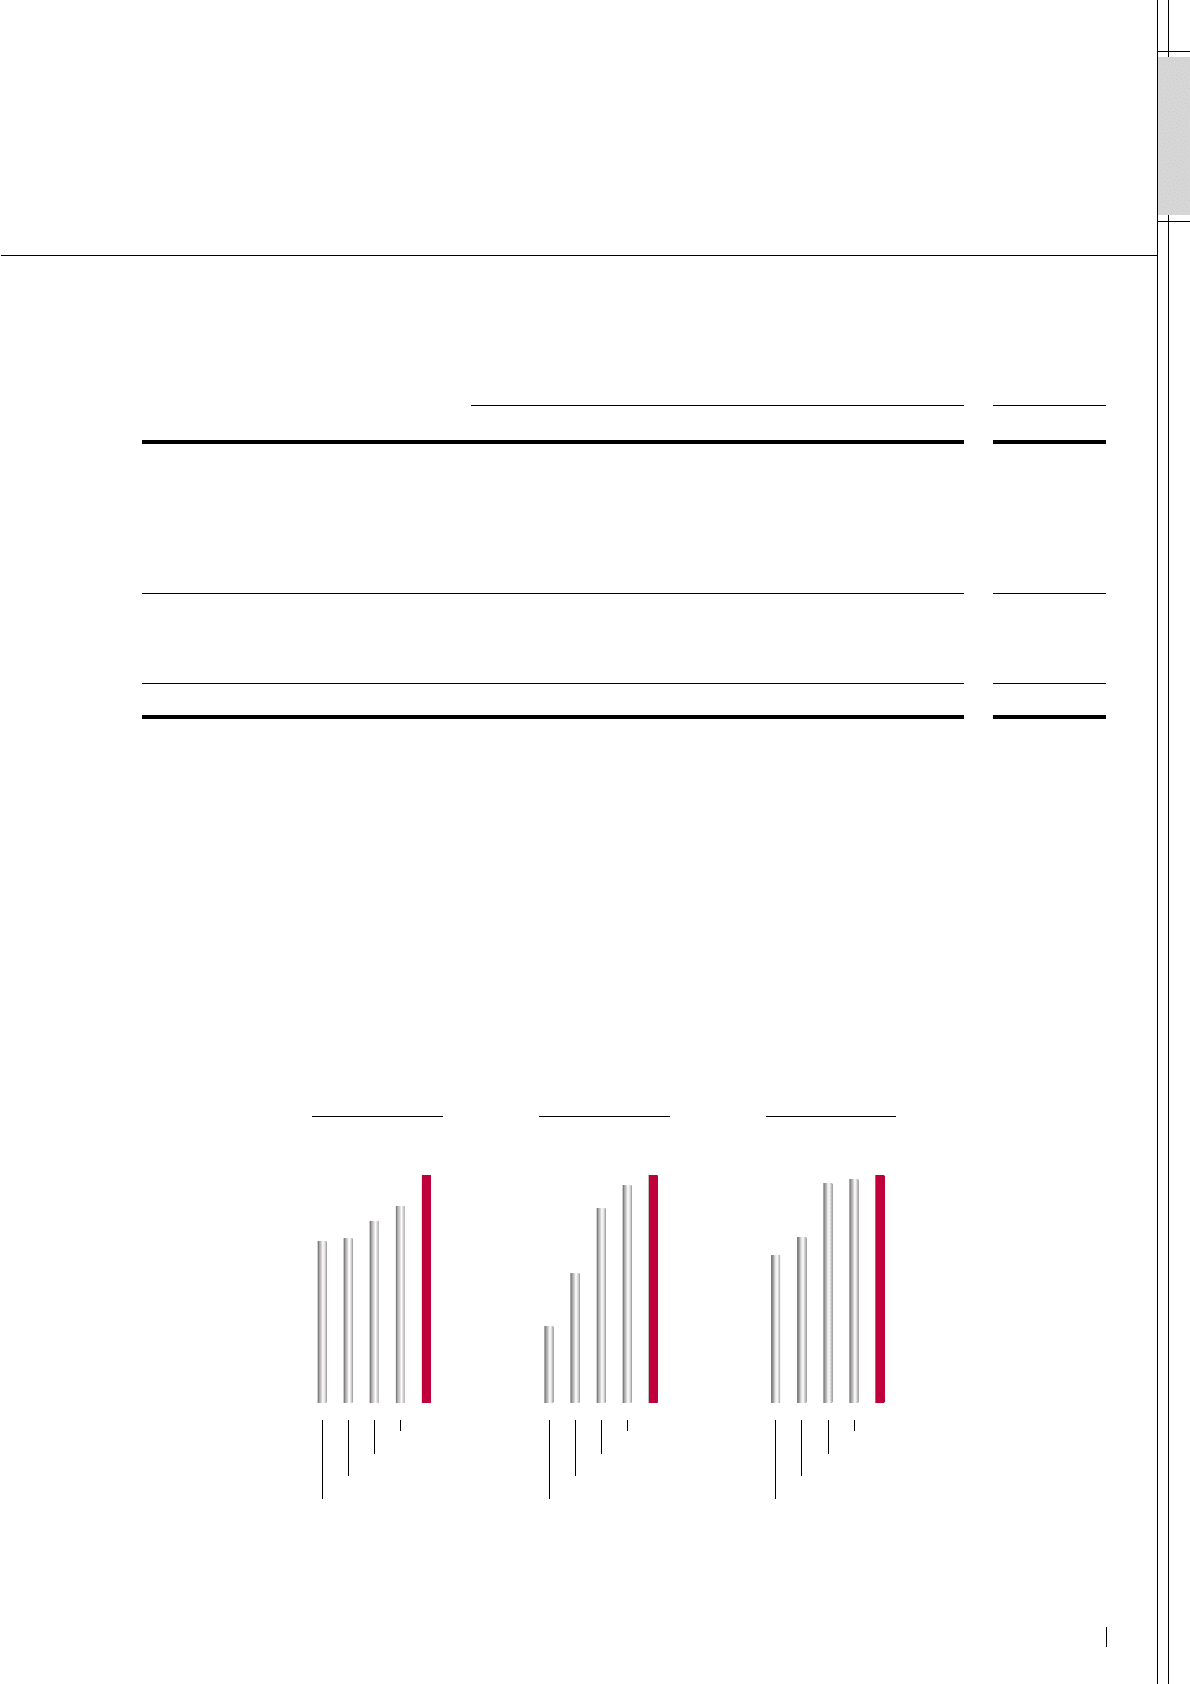
FINANCIAL HIGHLIGHTS
Nissan Motor Co., Ltd. And Consolidated Subsidiaries
Fiscal years 2004, 2003, 2002, 2001 and 2000
’00 ’01 ’02 ’03 ’04 ’00 ’01 ’02 ’03 ’04 ’00 ’01 ’02 ’03 ’04
6,090
6,196
6,829
7,429
8,576
290
489
737
825
861
331
372
495
504
512
Net Sales
(Billion Yen)
Operating Income
(Billion Yen)
Net Income
(Billion Yen)