Nissan 2005 Annual Report Download - page 104
Download and view the complete annual report
Please find page 104 of the 2005 Nissan annual report below. You can navigate through the pages in the report by either clicking on the pages listed below, or by using the keyword search tool below to find specific information within the annual report.-
 1
1 -
2
-
3
-
4
-
5
-
6
-
7
-
8
-
9
-
10
-
11
-
12
-
13
-
14
-
15
-
16
-
17
-
18
-
19
-
20
-
21
-
22
-
23
-
24
-
25
-
26
-
27
-
28
-
29
-
30
-
31
-
32
-
33
-
34
-
35
-
36
-
37
-
38
-
39
-
40
-
41
-
42
-
43
-
44
-
45
-
46
-
47
-
48
-
49
-
50
-
51
-
52
-
53
-
54
-
55
-
56
-
57
-
58
-
59
-
60
-
61
-
62
-
63
-
64
-
65
-
66
-
67
-
68
-
69
-
70
-
71
-
72
-
73
-
74
-
75
-
76
-
77
-
78
-
79
-
80
-
81
-
82
-
83
-
84
-
85
-
86
-
87
-
88
-
89
-
90
-
91
-
92
-
93
-
 94
94 -
 95
95 -
 96
96 -
 97
97 -
 98
98 -
 99
99 -
 100
100 -
 101
101 -
 102
102 -
 103
103 -
 104
104 -
 105
105 -
 106
106 -
 107
107 -
 108
108 -
 109
109 -
 110
110 -
 111
111 -
 112
112 -
 113
113 -
 114
114
 |
 |

FINANCIAL SECTION
Nissan Annual Report 2004
102
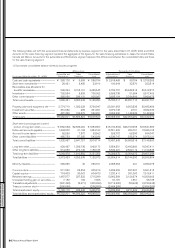
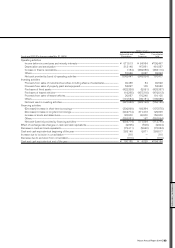
Fiscal year 2002 (For the year ended Mar. 31, 2003)
Other foreign
Japan North America Europe countries Total Eliminations Consolidated
Millions of yen
Sales to third parties.......................................... ¥2,554,374 ¥2,879,500 ¥963,440 ¥431,274 ¥6,828,588 ¥ — ¥6,828,588
Inter-area sales and transfers
.............................. 1,766,102 32,763 26,765 4,174 1,829,804 (1,829,804) —
Total sales................................................................... 4,320,476 2,912,263 990,205 435,448 8,658,392 (1,829,804) 6,828,588
Operating expenses ........................................... 3,929,920 2,607,699 968,253 418,682 7,924,554 (1,833,196) 6,091,358
Operating income................................................. ¥ 390,556 ¥ 304,564 ¥ 21,952 ¥ 16,766 ¥ 733,838 ¥ 3,392 ¥ 737,230
Total assets ............................................................... ¥4,881,842 ¥3,463,261 ¥502,028 ¥140,849 ¥8,987,980 ¥(1,638,797) ¥7,349,183
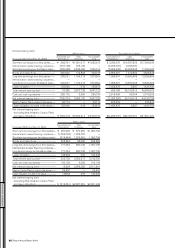
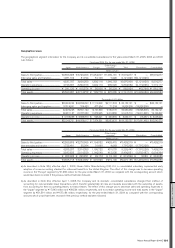
Overseas sales
Overseas sales, which include export sales of the Company and its domestic consolidated subsidiaries and sales (other than exports to Japan) of
the foreign consolidated subsidiaries, for the years ended March 31, 2005, 2004 and 2003 are summarized as follows:
Fiscal year 2004 (For the year ended Mar. 31, 2005)
Other foreign
North America Europe countries Total
Millions of yen
Overseas sales.................................................................................................................................................... ¥3,662,436 ¥1,269,204 ¥1,401,592 ¥6,333,232
Consolidated net sales................................................................................................................................. 8,576,277
Thousands of U.S. dollars
Overseas sales................................................................................................................................................ $34,228,374 $11,861,720 $13,098,991 $59,189,085
Consolidated net sales............................................................................................................................. 80,152,122
Overseas sales as a percentage of consolidated net sales...................................... 42.7% 14.8% 16.3% 73.8%
Fiscal year 2003 (For the year ended Mar. 31, 2004)
Other foreign
North America Europe countries Total
Millions of yen
Overseas sales.................................................................................................................................................... ¥3,222,497 ¥1,201,035 ¥773,248 ¥5,196,780
Consolidated net sales................................................................................................................................. 7,429,219
Overseas sales as a percentage of consolidated net sales.......................................... 43.4% 16.2% 10.4% 70.0%
Fiscal year 2002 (For the year ended Mar. 31, 2003)
Other foreign
North America Europe countries Total
Millions of yen
Overseas sales.................................................................................................................................................... ¥2,785,334 ¥974,872 ¥763,368 ¥4,523,574
Consolidated net sales................................................................................................................................. 6,828,588
Overseas sales as a percentage of consolidated net sales.......................................... 40.8% 14.3% 11.1% 66.2%