Nissan 2005 Annual Report Download - page 100
Download and view the complete annual report
Please find page 100 of the 2005 Nissan annual report below. You can navigate through the pages in the report by either clicking on the pages listed below, or by using the keyword search tool below to find specific information within the annual report.-
 1
1 -
2
-
3
-
4
-
5
-
6
-
7
-
8
-
9
-
10
-
11
-
12
-
13
-
14
-
15
-
16
-
17
-
18
-
19
-
20
-
21
-
22
-
23
-
24
-
25
-
26
-
27
-
28
-
29
-
30
-
31
-
32
-
33
-
34
-
35
-
36
-
37
-
38
-
39
-
40
-
41
-
42
-
43
-
44
-
45
-
46
-
47
-
48
-
49
-
50
-
51
-
52
-
53
-
54
-
55
-
56
-
57
-
58
-
59
-
60
-
61
-
62
-
63
-
64
-
65
-
66
-
67
-
68
-
69
-
70
-
71
-
72
-
73
-
74
-
75
-
76
-
77
-
78
-
79
-
80
-
81
-
82
-
83
-
84
-
85
-
86
-
87
-
88
-
89
-
 90
90 -
 91
91 -
 92
92 -
 93
93 -
 94
94 -
 95
95 -
 96
96 -
 97
97 -
 98
98 -
 99
99 -
 100
100 -
 101
101 -
 102
102 -
 103
103 -
 104
104 -
 105
105 -
 106
106 -
 107
107 -
 108
108 -
 109
109 -
 110
110 -
111
-
112
-
113
-
114
 |
 |

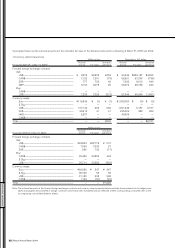
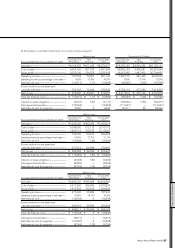
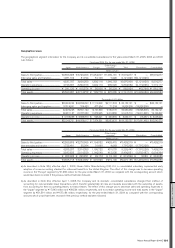
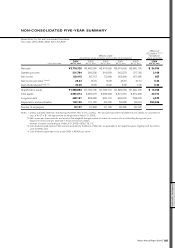
3) Summarized consolidated statements of cash flows by business segment
Millions of yen Thousands of U.S. dollars
Automobile and Sales Consolidated Automobile and Sales Consolidated
Fiscal year 2004 (For the year ended Mar. 31, 2005) Eliminations Financing total Eliminations Financing total
Operating activities
Income before income taxes and
minority interests................................................................... ¥720,764 ¥ 72,469 ¥793,233 $6,736,113 $ 677,280 $7,413,393
Depreciation and amortization...................................... 349,163 176,763 525,926 3,263,205 1,651,991 4,915,196
(Increase) decrease in sales
finance receivables.............................................................. 17,131 (811,480) (794,349) 160,103 (7,583,925) (7,423,822)
Others ............................................................................................... (207,813) 52,418 (155,395) (1,942,178) 489,888 (1,452,290)
Net cash provided by (used in)
operating activities............................................................... 879,245 (509,830) 369,415 8,217,243 (4,764,766) 3,452,477
Investing activities
Proceeds from sales of investment securities
including shares of subsidiaries ............................... 10,285 510 10,795 96,122 4,766 100,888
Proceeds from sales of property,
plant and equipment........................................................... 71,256 — 71,256 665,944 — 665,944
Purchases of fixed assets................................................ (453,357) (7,789) (461,146) (4,236,982) (72,794) (4,309,776)
Purchases of leased vehicles........................................ (15,926) (574,679) (590,605) (148,841) (5,370,832) (5,519,673)
Proceeds from sales of leased vehicles ............... 16,143 157,669 173,812 150,869 1,473,542 1,624,411
Others ............................................................................................... (79,115) 9,968 (69,147) (739,392) 93,159 (646,233)
Net cash used in investing activities........................ (450,714) (414,321) (865,035) (4,212,280) (3,872,159) (8,084,439)
Financing activities
Increase (decrease) in short-term
borrowings.................................................................................. 174,500 491,691 666,191 1,630,841 4,595,243 6,226,084
(Decrease) increase in long-term
borrowings.................................................................................. (391,244) 296,551 (94,693) (3,656,486) 2,771,505 (884,981)
Increase in bonds and debentures............................ — 140,663 140,663 — 1,314,607 1,314,607
Others ............................................................................................... (191,998) 883 (191,115) (1,794,373) 8,252 (1,786,121)
Net cash (used in) provided by
financing activities................................................................ (408,742) 929,788 521,046 (3,820,018) 8,689,607 4,869,589
Effect of exchange rate changes on cash
and cash equivalents .................................................................. 4,427 (58) 4,369 41,373 (542) 40,831
Increase in cash and cash
equivalents .......................................................................................... 24,216 5,579 29,795 226,318 52,140 278,458
Cash and cash equivalents at beginning
of the year............................................................................................ 190,135 4,029 194,164 1,776,963 37,654 1,814,617
Increase due to inclusion in consolidation................... 65,825 — 65,825 615,187 — 615,187
Cash and cash equivalents at end of the year.......... ¥280,176 ¥ 9,608 ¥289,784 $2,618,468 $ 89,794 $2,708,262
FINANCIAL SECTION
Nissan Annual Report 2004
98