Memorex 2010 Annual Report Download - page 64
Download and view the complete annual report
Please find page 64 of the 2010 Memorex annual report below. You can navigate through the pages in the report by either clicking on the pages listed below, or by using the keyword search tool below to find specific information within the annual report.-
 1
1 -
2
-
3
-
4
-
5
-
6
-
7
-
8
-
9
-
10
-
11
-
12
-
13
-
14
-
15
-
16
-
17
-
18
-
19
-
20
-
21
-
22
-
23
-
24
-
25
-
26
-
27
-
28
-
29
-
30
-
31
-
32
-
33
-
34
-
35
-
36
-
37
-
38
-
39
-
40
-
41
-
42
-
43
-
44
-
45
-
46
-
47
-
48
-
49
-
50
-
51
-
52
-
53
-
 54
54 -
 55
55 -
 56
56 -
 57
57 -
 58
58 -
 59
59 -
 60
60 -
 61
61 -
 62
62 -
 63
63 -
 64
64 -
 65
65 -
 66
66 -
 67
67 -
 68
68 -
 69
69 -
 70
70 -
 71
71 -
 72
72 -
 73
73 -
 74
74 -
75
-
76
-
77
-
78
-
79
-
80
-
81
-
82
-
83
-
84
-
85
-
86
-
87
-
88
-
89
-
90
-
91
-
92
-
93
-
94
-
95
-
96
-
97
-
98
-
99
-
100
-
101
-
102
-
103
-
104
-
105
-
106
 |
 |

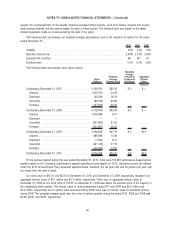
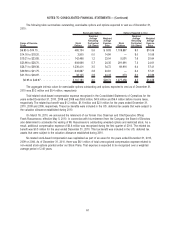
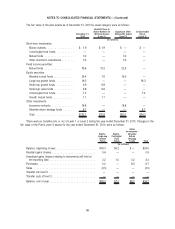
The following table summarizes outstanding, exercisable options and options expected to vest as of December 31,
2010:
Range of Exercise
Prices
Stock
Options
Weighted
Average
Remaining
Contractual
Life (Years)
Weighted
Average
Exercise
Price
Stock
Options
Weighted
Average
Remaining
Contractual
Life (Years)
Weighted
Average
Exercise
Price
Exercisable Options Options Expected to Vest
$6.95 to $14.15 . . . . . . . . . . . . . . . . . . . . . 485,134 5.6 $ 9.93 1,109,887 9.0 $10.06
$14.16 to $19.20 . . . . . . . . . . . . . . . . . . . . 3,500 0.0 14.94 — 9.0 10.06
$19.21 to $23.95 . . . . . . . . . . . . . . . . . . . . 142,468 1.2 23.04 5,591 7.6 20.64
$23.96 to $28.70 . . . . . . . . . . . . . . . . . . . . 608,666 5.7 24.35 291,691 7.3 24.61
$28.71 to $39.38 . . . . . . . . . . . . . . . . . . . . 1,236,401 3.5 34.72 69,916 6.4 37.41
$39.39 to $41.75 . . . . . . . . . . . . . . . . . . . . 646,887 2.8 40.81 — 6.4 37.41
$41.76 to $46.97 . . . . . . . . . . . . . . . . . . . . 38,125 2.9 44.43 373 6.0 45.89
$6.95 to $46.97 . . . . . . . . . . . . . . . . . . . 3,161,181 4.0 $29.74 1,477,458 8.5 $14.28
The aggregate intrinsic value for exercisable options outstanding and options expected to vest as of December 31,
2010 was $0.2 million and $0.4 million, respectively.
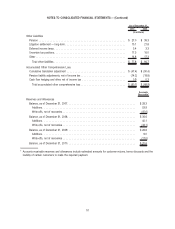
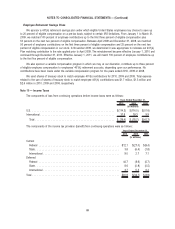
Total related stock-based compensation expense recognized in the Consolidated Statements of Operations for the
years ended December 31, 2010, 2009 and 2008 was $3.8 million, $4.9 million and $6.4 million before income taxes,
respectively. The related tax benefit was $1.2 million, $1.6 million and $2.0 million for the years ended December 31,
2010, 2009 and 2008, respectively. These tax benefits were included in the U.S. deferred tax assets that were subject to
the valuation allowance established during 2010.
On March 18, 2010, we announced the retirement of our former Vice Chairman and Chief Executive Officer,
Frank Russomanno, effective May 5, 2010. In connection with his retirement from the Company, the Board of Directors
also determined to accelerate the vesting of Mr. Russomanno’s outstanding unvested options and restricted stock. As a
result, additional compensation expense of $0.8 million was recognized during the first quarter of 2010. The related tax
benefit was $0.3 million for the year ended December 31, 2010. This tax benefit was included in the U.S. deferred tax
assets that were subject to the valuation allowance established during 2010.
No related stock-based compensation was capitalized as part of an asset for the years ended December 31, 2010,
2009 or 2008. As of December 31, 2010, there was $6.1 million of total unrecognized compensation expense related to
non-vested stock options granted under our Stock Plans. That expense is expected to be recognized over a weighted
average period of 2.46 years.
61
NOTES TO CONSOLIDATED FINANCIAL STATEMENTS — (Continued)