Memorex 2010 Annual Report Download - page 31
Download and view the complete annual report
Please find page 31 of the 2010 Memorex annual report below. You can navigate through the pages in the report by either clicking on the pages listed below, or by using the keyword search tool below to find specific information within the annual report.-
 1
1 -
2
-
3
-
4
-
5
-
6
-
7
-
8
-
9
-
10
-
11
-
12
-
13
-
14
-
15
-
16
-
17
-
18
-
19
-
20
-
 21
21 -
 22
22 -
 23
23 -
 24
24 -
 25
25 -
 26
26 -
 27
27 -
 28
28 -
 29
29 -
 30
30 -
 31
31 -
 32
32 -
 33
33 -
 34
34 -
 35
35 -
 36
36 -
 37
37 -
 38
38 -
 39
39 -
 40
40 -
 41
41 -
42
-
43
-
44
-
45
-
46
-
47
-
48
-
49
-
50
-
51
-
52
-
53
-
54
-
55
-
56
-
57
-
58
-
59
-
60
-
61
-
62
-
63
-
64
-
65
-
66
-
67
-
68
-
69
-
70
-
71
-
72
-
73
-
74
-
75
-
76
-
77
-
78
-
79
-
80
-
81
-
82
-
83
-
84
-
85
-
86
-
87
-
88
-
89
-
90
-
91
-
92
-
93
-
94
-
95
-
96
-
97
-
98
-
99
-
100
-
101
-
102
-
103
-
104
-
105
-
106
 |
 |

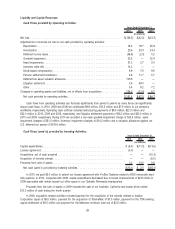
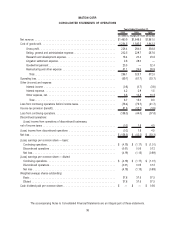
Liquidity and Capital Resources
Cash Flows provided by Operating Activities:
2010 2009 2008
Years Ended December 31,
(In millions)
Net loss . . . . . . . . . . . . . . . . . . . . . . . . . . . . . . . . . . . . . . . . . . . . . . . . . . . . . . . . . . . $(158.5) $(42.2) $(33.3)
Adjustments to reconcile net loss to net cash provided by operating activities:
Depreciation . . . . . . . . . . . . . . . . . . . . . . . . . . . . . . . . . . . . . . . . . . . . . . . . . . . . . . 18.2 19.7 25.9
Amortization . . . . . . . . . . . . . . . . . . . . . . . . . . . . . . . . . . . . . . . . . . . . . . . . . . . . . . 23.6 23.3 23.4
Deferred income taxes . . . . . . . . . . . . . . . . . . . . . . . . . . . . . . . . . . . . . . . . . . . . . . . (48.6) (2.0) 0.2
Goodwill impairment . . . . . . . . . . . . . . . . . . . . . . . . . . . . . . . . . . . . . . . . . . . . . . . . . 23.5 — 32.4
Asset impairments . . . . . . . . . . . . . . . . . . . . . . . . . . . . . . . . . . . . . . . . . . . . . . . . . . 31.2 2.7 5.0
Inventory write-offs . . . . . . . . . . . . . . . . . . . . . . . . . . . . . . . . . . . . . . . . . . . . . . . . . . 14.2 — —
Stock-based compensation . . . . . . . . . . . . . . . . . . . . . . . . . . . . . . . . . . . . . . . . . . . . 6.9 7.5 9.5
Pension settlement/curtailment . . . . . . . . . . . . . . . . . . . . . . . . . . . . . . . . . . . . . . . . . . 2.8 11.7 5.7
Deferred tax asset valuation allowance . . . . . . . . . . . . . . . . . . . . . . . . . . . . . . . . . . . . 105.6 — —
Litigation settlement . . . . . . . . . . . . . . . . . . . . . . . . . . . . . . . . . . . . . . . . . . . . . . . . . 2.6 49.0 —
Other . . . . . . . . . . . . . . . . . . . . . . . . . . . . . . . . . . . . . . . . . . . . . . . . . . . . . . . . . . . 5.4 9.2 7.2
Changes in operating assets and liabilities, net of effects from acquisitions . . . . . . . . . . . . . 124.5 (11.4) 8.7
Net cash provided by operating activities. . . . . . . . . . . . . . . . . . . . . . . . . . . . . . . . . . . $ 151.4 $ 67.5 $ 84.7
Cash flows from operating activities can fluctuate significantly from period to period as many items can significantly
impact cash flows. In 2010, 2009 and 2008 we contributed $9.9 million, $10.3 million and $7.6 million to our pensions
worldwide, respectively. Operating cash outflows included restructuring payments of $9.5 million, $22.3 million and
$32.0 million in 2010, 2009 and 2008, respectively, and litigation settlement payments of $8.2 million and $20.0 million in
2010 and 2009, respectively. During 2010 we recorded a non-cash goodwill impairment charge of $23.5 million, asset
impairment charges of $31.2 million, inventory impairment charges of $14.2 million and a valuation allowance against our
U.S. deferred tax assets of $105.6 million.
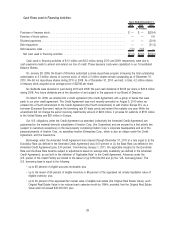
Cash Flows (used in) provided by Investing Activities:
2010 2009 2008
Years Ended December 31,
(In millions)
Capital expenditures. . . . . . . . . . . . . . . . . . . . . . . . . . . . . . . . . . . . . . . . . . . . . . . . . . . . $ (8.3) $(11.0) $(13.6)
License agreement . . . . . . . . . . . . . . . . . . . . . . . . . . . . . . . . . . . . . . . . . . . . . . . . . . . . (5.0) — —
Acquisitions, net of cash acquired . . . . . . . . . . . . . . . . . . . . . . . . . . . . . . . . . . . . . . . . . . — — (15.3)
Acquisition of minority interest . . . . . . . . . . . . . . . . . . . . . . . . . . . . . . . . . . . . . . . . . . . . . — — (8.0)
Proceeds from sale of assets . . . . . . . . . . . . . . . . . . . . . . . . . . . . . . . . . . . . . . . . . . . . . 0.2 13.0 0.8
Net cash (used in) provided by investing activities . . . . . . . . . . . . . . . . . . . . . . . . . . . . . $(13.1) $ 2.0 $(36.1)
In 2010, we paid $5.0 million to extend our license agreement with ProStor Systems related to RDX removable hard
disk systems. In 2010, compared with 2009, capital expenditures decreased due to tenant improvements of $2.9 million in
2009 associated with certain leased out office space in our Oakdale, Minnesota headquarters.
Proceeds from the sale of assets in 2009 included the sale of our Anaheim, California real estate which netted
$12.2 million of cash during the fourth quarter.
In 2008, acquisition related activities included payment for the acquisition of the minority interest in Imation
Corporation Japan of $8.0 million, payment for the acquisition of XtremeMac of $7.3 million, payment for the TDK working
capital settlement of $6.5 million and payment for the Memorex minimum earn-out of $2.5 million.
28