Memorex 2010 Annual Report Download - page 21
Download and view the complete annual report
Please find page 21 of the 2010 Memorex annual report below. You can navigate through the pages in the report by either clicking on the pages listed below, or by using the keyword search tool below to find specific information within the annual report.-
 1
1 -
2
-
3
-
4
-
5
-
6
-
7
-
8
-
9
-
10
-
 11
11 -
 12
12 -
 13
13 -
 14
14 -
 15
15 -
 16
16 -
 17
17 -
 18
18 -
 19
19 -
 20
20 -
 21
21 -
 22
22 -
 23
23 -
 24
24 -
 25
25 -
 26
26 -
 27
27 -
 28
28 -
 29
29 -
 30
30 -
 31
31 -
32
-
33
-
34
-
35
-
36
-
37
-
38
-
39
-
40
-
41
-
42
-
43
-
44
-
45
-
46
-
47
-
48
-
49
-
50
-
51
-
52
-
53
-
54
-
55
-
56
-
57
-
58
-
59
-
60
-
61
-
62
-
63
-
64
-
65
-
66
-
67
-
68
-
69
-
70
-
71
-
72
-
73
-
74
-
75
-
76
-
77
-
78
-
79
-
80
-
81
-
82
-
83
-
84
-
85
-
86
-
87
-
88
-
89
-
90
-
91
-
92
-
93
-
94
-
95
-
96
-
97
-
98
-
99
-
100
-
101
-
102
-
103
-
104
-
105
-
106
 |
 |
Factors Affecting Comparability of our Financial Results
Discontinued Operations
As a result of the wind down of our Global Data Media (GDM) business joint venture during 2009 it was determined
that the GDM operations and cash flows would be eliminated from our ongoing operations and that we would not have
any significant continuing involvement in the operations of GDM after the exit from the joint venture. As a result, these
operations are presented in our Consolidated Financial Statements as discontinued operations for all periods presented.
GDM was a joint venture created to market optical media products with Moser Baer India Ltd. (MBI). Since the inception
of the joint venture in 2003, we held a 51 percent ownership in the business. As the controlling shareholder, we have
historically consolidated the results of the joint venture in our financial statements. GDM was included partially in the
Americas and Europe segments. Operating results of the GDM business joint venture are included as discontinued
operations for the current period and all prior periods presented in the Consolidated Statements of Operations. See Note 4
to the Consolidated Financial Statements for further information.
Executive Summary
2010 Consolidated Results of Operations
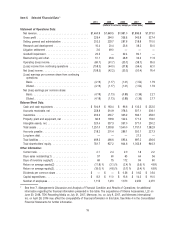
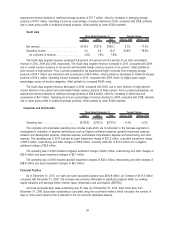
• Revenue of $1,460.9 million in 2010 was down 11.4 percent compared with revenue of $1,649.5 million in 2009
due primarily to lower demand for our traditional storage products and the continuing soft economy.
• Gross margin of 15.5 percent in 2010 was down from 16.0 percent in 2009, due to inventory write-offs of
$14.2 million which were part of our 2011 manufacturing redesign restructuring plan announced January 18, 2011.
• Selling, general and administrative expense was $202.5 million in 2010, down $27.2 million, compared with
$229.7 million in 2009.
• Research and development expense was $16.4 million in 2010, down $4.0 million, compared with $20.4 million in
2009.
• We recorded a non-cash goodwill impairment charge of $23.5 million in 2010. There were no goodwill impairment
charges in 2009.
• Restructuring and other expense was $51.1 million in 2010, an increase of $24.5 million, compared with
$26.6 million in 2009, primarily related to the restructuring programs announced in January 2011.
• Other expense was $6.7 million in 2010, down $8.3 million, compared with $15.0 million in 2009.
• The income tax provision was $81.9 million in 2010, compared with an income tax benefit of $32.7 million in 2009,
an increase of $114.6 million. This change was primarily due to the establishment of a $105.6 million valuation
allowance on our U.S. deferred tax assets. Other items that had an impact on the 2010 income tax provision
included a change in the state tax effective rate, reserves for uncertain tax positions, foreign earnings subject to
U.S. taxation, and changes in the mix of income by jurisdiction.
• Operating loss was $69.7 million in 2010, compared with $61.7 million in 2009.
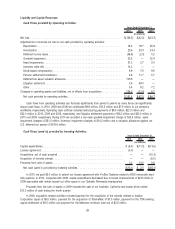
2010 Cash Flow/Financial Condition
• Cash and cash equivalents totaled $304.9 million as of December 31, 2010 compared with $163.4 million as of
December 31, 2009.
• Cash flow provided by operating activities was $151.4 million for 2010 compared with $67.5 million for 2009.
18