Memorex 2010 Annual Report Download - page 47
Download and view the complete annual report
Please find page 47 of the 2010 Memorex annual report below. You can navigate through the pages in the report by either clicking on the pages listed below, or by using the keyword search tool below to find specific information within the annual report.-
 1
1 -
2
-
3
-
4
-
5
-
6
-
7
-
8
-
9
-
10
-
11
-
12
-
13
-
14
-
15
-
16
-
17
-
18
-
19
-
20
-
21
-
22
-
23
-
24
-
25
-
26
-
27
-
28
-
29
-
30
-
31
-
32
-
33
-
34
-
35
-
36
-
 37
37 -
 38
38 -
 39
39 -
 40
40 -
 41
41 -
 42
42 -
 43
43 -
 44
44 -
 45
45 -
 46
46 -
 47
47 -
 48
48 -
 49
49 -
 50
50 -
 51
51 -
 52
52 -
 53
53 -
 54
54 -
 55
55 -
 56
56 -
 57
57 -
58
-
59
-
60
-
61
-
62
-
63
-
64
-
65
-
66
-
67
-
68
-
69
-
70
-
71
-
72
-
73
-
74
-
75
-
76
-
77
-
78
-
79
-
80
-
81
-
82
-
83
-
84
-
85
-
86
-
87
-
88
-
89
-
90
-
91
-
92
-
93
-
94
-
95
-
96
-
97
-
98
-
99
-
100
-
101
-
102
-
103
-
104
-
105
-
106
 |
 |
Impairment of Long-Lived Assets. We periodically review the carrying value of our property and equipment and our
intangible assets to test whether current events or circumstances indicate that such carrying value may not be recoverable.
If the tests indicate that the carrying value of the asset is greater than the expected undiscounted cash flows to be
generated by such asset or asset group, an impairment loss would be recognized. The impairment loss is determined by
the amount by which the carrying value of such asset or asset group exceeds its fair value. We generally measure fair
value by considering sale prices for similar assets or by discounting estimated future cash flows from such assets using an
appropriate discount rate. Assets to be disposed of are carried at the lower of their carrying value or fair value less costs
to sell. Considerable management judgment is necessary to estimate the fair value of assets and, accordingly, actual
results could vary significantly from such estimates.
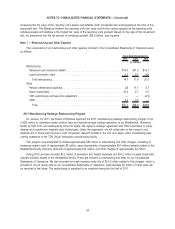
In conjunction with the 2011 manufacturing redesign restructuring program announced in January 2011, certain
assets held primarily at our Weatherford, Oklahoma facility were determined to be impaired in accordance with the
provisions of impairment of long-lived assets. These long-lived assets held and used include the property, building and
equipment primarily related to the manufacturing of magnetic tape which will be consolidated to the TDK Group Yamanashi
manufacturing facility in April 2011. TDK Corporation (TDK) is a related party to Imation. These assets had a carrying
amount of $17.0 million and were written down to their fair value of $2.3 million, resulting in an impairment charge of
$14.7 million. The fair value of the equipment was assessed based upon sales proceeds from similar equipment sold as
part of the closing of our Camarillo, California facility. These assets had a carrying amount of $17.4 million and were
written down to their fair value of $0.9 million, resulting in an impairment charge of $16.5 million. Until these assets meet
the criteria for classification as held for sale, we will continue depreciating these assets over the remaining economic
useful life.
Revenue Recognition. We sell a wide range of removable data storage media products as well as certain consumer
electronic products. Net revenue consists primarily of magnetic, optical, flash media, consumer electronics and accessories
sales. We recognize revenue in accordance with the authoritative guidance governing revenue recognition which requires
that persuasive evidence of an arrangement exists, delivery has occurred or services have been rendered, fees are fixed
or determinable and collectability is reasonably assured. For product sales, delivery is considered to have occurred when
the risks and rewards of ownership transfer to the customer. For inventory maintained at the customer site, revenue is
recognized at the time these products are sold by the customer. We base our estimates for returns on historical experience
and have not experienced significant fluctuations between estimated and actual return activity. Non-income based taxes
collected from customers and remitted to governmental authorities include levies and various excise taxes, mainly in non
U.S. jurisdictions. These taxes included in revenue in 2010, 2009, and 2008 were $28.3, $50.9 million, and $75.9 million,
respectively.
Concentrations of Credit Risk. We sell a wide range of products and services to a diversified base of customers
around the world and perform ongoing credit evaluations of our customers’ financial condition. Therefore, we believe there
is no material concentration of credit risk. No single customer represented more than 10 percent of total net revenue in
2010, 2009, or 2008.
Inventory Related Shipping and Handling Costs. Costs related to shipping and handling are included in cost of
goods sold.
Research and Development Costs. Research and development costs are charged to expense as incurred. Research
and development costs include salaries, stock compensation, payroll taxes, employee benefit costs, supplies, depreciation
and maintenance of research equipment as well as the allocable portion of facility costs such as rent, utilities, insurance,
repairs, maintenance and general support services.
Advertising Costs. Advertising and other promotional costs are expensed as incurred and were approximately
$4 million, $6 million and $14 million in 2010, 2009 and 2008, respectively. Prepaid advertising costs were not significant at
December 31, 2010 or 2009.
Rebates. We provide rebates to our customers. Customer rebates are accounted for as a reduction of revenue at
the time of sale based on an estimate of the cost to honor the related rebate programs.
44
NOTES TO CONSOLIDATED FINANCIAL STATEMENTS — (Continued)