Memorex 2010 Annual Report Download - page 28
Download and view the complete annual report
Please find page 28 of the 2010 Memorex annual report below. You can navigate through the pages in the report by either clicking on the pages listed below, or by using the keyword search tool below to find specific information within the annual report.-
 1
1 -
2
-
3
-
4
-
5
-
6
-
7
-
8
-
9
-
10
-
11
-
12
-
13
-
14
-
15
-
16
-
17
-
 18
18 -
 19
19 -
 20
20 -
 21
21 -
 22
22 -
 23
23 -
 24
24 -
 25
25 -
 26
26 -
 27
27 -
 28
28 -
 29
29 -
 30
30 -
 31
31 -
 32
32 -
 33
33 -
 34
34 -
 35
35 -
 36
36 -
 37
37 -
 38
38 -
39
-
40
-
41
-
42
-
43
-
44
-
45
-
46
-
47
-
48
-
49
-
50
-
51
-
52
-
53
-
54
-
55
-
56
-
57
-
58
-
59
-
60
-
61
-
62
-
63
-
64
-
65
-
66
-
67
-
68
-
69
-
70
-
71
-
72
-
73
-
74
-
75
-
76
-
77
-
78
-
79
-
80
-
81
-
82
-
83
-
84
-
85
-
86
-
87
-
88
-
89
-
90
-
91
-
92
-
93
-
94
-
95
-
96
-
97
-
98
-
99
-
100
-
101
-
102
-
103
-
104
-
105
-
106
 |
 |

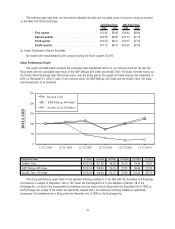
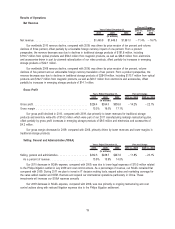
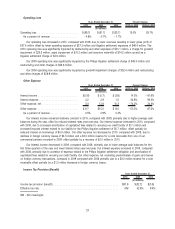
with 2009, due to price declines of nine percent and volume declines of six percent. From a product perspective, we
experienced lower revenues from traditional storage products of $82.2 million and electronics and accessories of
$48.8 million, offset partially by increases in emerging storage products of $8.8 million. Operating income decreased in
2010, compared with 2009, driven primarily by lower gross profits from traditional storage products, offset partially by
higher gross margins on emerging storage products. Operating income as a percentage of revenue decreased in 2010,
compared with 2009, driven primarily by lower revenue and lower gross margin percentages on traditional storage products,
offset partially by lower SG&A.
The Americas segment revenue decreased in 2009, compared with 2008, due to price declines of 11 percent and
volume declines of 6 percent. From a product perspective, we experienced revenue declines across all product categories.
Operating income decreased in 2009, compared with 2008, driven primarily by lower gross profits in traditional storage
products, specifically magnetic products. Operating income decreased in 2009, compared with 2008, due primarily to
declining revenues and gross margins in traditional storage products, offset partially by lower SG&A expense.
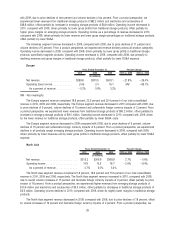
Europe
2010 2009 2008 2010 vs. 2009 2009 vs. 2008
Years Ended December 31, Percent Change
(In millions)
Net revenue. . . . . . . . . . . . . . . . . . . . . $289.8 $370.5 $503.1 ⫺21.8% ⫺26.4%
Operating (loss) income . . . . . . . . . . . . (0.6) 2.4 16.1 NM ⫺85.1%
As a percent of revenue . . . . . . . . . . ⫺0.2% 0.6% 3.2%
NM - Not meaningful
The Europe segment revenue comprised 19.8 percent, 22.5 percent and 25.4 percent of our total consolidated
revenue in 2010, 2009 and 2008, respectively. The Europe segment revenue decreased in 2010 compared with 2009, due
to price declines of 5 percent, volume declines of 15 percent and unfavorable foreign currency impacts of 2 percent. From
a product perspective, we experienced lower revenues from traditional storage products of $90.2 million, offset partially by
increases in emerging storage products of $8.0 million. Operating income decreased in 2010, compared with 2009, driven
by the lower revenue on traditional storage products, offset partially by lower SG&A costs.
The Europe segment revenue decreased in 2009 compared with 2008, due to price declines of 6 percent, volume
declines of 15 percent and unfavorable foreign currency impacts of 6 percent. From a product perspective, we experienced
declines in all products except emerging storage products. Operating income decreased in 2009, compared with 2008,
driven primarily by lower revenues and by lower gross profits in traditional storage products, offset partially by lower SG&A
expense.
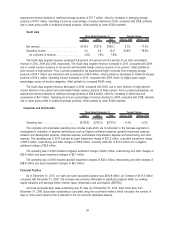
North Asia
2010 2009 2008 2010 vs. 2009 2009 vs. 2008
Years Ended December 31, Percent Change
(In millions)
Net revenue . . . . . . . . . . . . . . . . . . . . . . . . $315.2 $306.9 $308.9 2.7% ⫺0.6%
Operating income . . . . . . . . . . . . . . . . . . . . 14.9 15.3 16.7 ⫺2.6% ⫺8.4%
As a percent of revenue. . . . . . . . . . . . . . 4.7% 5.0% 5.4%
The North Asia segment revenue comprised 21.6 percent, 18.6 percent and 15.6 percent of our total consolidated
revenue in 2010, 2009 and 2008, respectively. The North Asia segment revenue increased in 2010, compared with 2009,
due to overall volume increases of 15 percent and favorable foreign currency impacts of 6 percent, offset partially by price
erosion of 18 percent. From a product perspective, we experienced higher revenues from emerging storage products of
$10.6 million and electronics and accessories of $3.3 million, offset partially by decreases in traditional storage products of
$5.5 million. Operating income declined in 2010, compared with 2009, driven by slightly lower margins in traditional storage
products.
The North Asia segment revenue decreased in 2009, compared with 2008, due to price declines of 19 percent, offset
by volume increases of 16 percent and favorable foreign currency impacts of 2 percent. From a product perspective, we
25