Macy's 2010 Annual Report Download - page 96
Download and view the complete annual report
Please find page 96 of the 2010 Macy's annual report below. You can navigate through the pages in the report by either clicking on the pages listed below, or by using the keyword search tool below to find specific information within the annual report.-
 1
1 -
2
-
3
-
4
-
5
-
6
-
7
-
8
-
9
-
10
-
11
-
12
-
13
-
14
-
15
-
16
-
17
-
18
-
19
-
20
-
21
-
22
-
23
-
24
-
25
-
26
-
27
-
28
-
29
-
30
-
31
-
32
-
33
-
34
-
35
-
36
-
37
-
38
-
39
-
40
-
41
-
42
-
43
-
44
-
45
-
46
-
47
-
48
-
49
-
50
-
51
-
52
-
53
-
54
-
55
-
56
-
57
-
58
-
59
-
60
-
61
-
62
-
63
-
64
-
65
-
66
-
67
-
68
-
69
-
70
-
71
-
72
-
73
-
74
-
75
-
76
-
77
-
78
-
79
-
80
-
81
-
82
-
83
-
84
-
85
-
 86
86 -
 87
87 -
 88
88 -
 89
89 -
 90
90 -
 91
91 -
 92
92 -
 93
93 -
 94
94 -
 95
95 -
 96
96 -
 97
97 -
 98
98 -
 99
99 -
 100
100 -
 101
101 -
 102
102 -
 103
103 -
 104
104 -
 105
105 -
 106
106 -
107
-
108
-
109
-
110
-
111
-
112
 |
 |

NOTES TO CONSOLIDATED FINANCIAL STATEMENTS — (Continued)
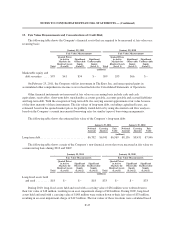
on the projected cash flows and an estimated risk-adjusted rate of return that would be used by market
participants in valuing these assets or prices of similar assets.
Financial instruments that potentially subject the Company to concentrations of credit risk consist
principally of temporary cash investments. The Company places its temporary cash investments in what it
believes to be high credit quality financial instruments.
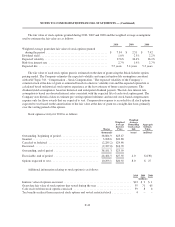
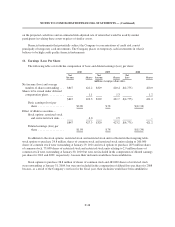
16. Earnings (Loss) Per Share
The following table sets forth the computation of basic and diluted earnings (loss) per share:
2010 2009 2008
Net
Income Shares
Net
Income Shares
Net
Loss Shares
(millions, except per share data)
Net income (loss) and average
number of shares outstanding . . . $847 422.2 $329 420.4 $(4,775) 420.0
Shares to be issued under deferred
compensation plans ........... 1.1 1.3 1.2
$847 423.3 $329 421.7 $(4,775) 421.2
Basic earnings (loss) per
share .................. $2.00 $.78 $(11.34)
Effect of dilutive securities –
Stock options, restricted stock
and restricted stock units . . 4.0 1.5 –
$847 427.3 $329 423.2 $(4,775) 421.2
Diluted earnings (loss) per
share .................. $1.98 $.78 $(11.34)
In addition to the stock options, restricted stock and restricted stock units reflected in the foregoing table,
stock options to purchase 24.8 million shares of common stock and restricted stock units relating to 260,000
shares of common stock were outstanding at January 29, 2011 and stock options to purchase 28.9 million shares
of common stock, 75,000 shares of restricted stock and restricted stock units relating to 2.9 million shares of
common stock were outstanding at January 30, 2010 but were not included in the computation of diluted earnings
per share for 2010 and 2009, respectively, because their inclusion would have been antidilutive.
Stock options to purchase 38.8 million of shares of common stock and 483,000 shares of restricted stock
were outstanding at January 31, 2009, but were not included in the computation of diluted loss per share for 2008
because, as a result of the Company’s net loss for the fiscal year, their inclusion would have been antidilutive.
F-48