Macy's 2010 Annual Report Download - page 26
Download and view the complete annual report
Please find page 26 of the 2010 Macy's annual report below. You can navigate through the pages in the report by either clicking on the pages listed below, or by using the keyword search tool below to find specific information within the annual report.-
 1
1 -
2
-
3
-
4
-
5
-
6
-
7
-
8
-
9
-
10
-
11
-
12
-
13
-
14
-
15
-
 16
16 -
 17
17 -
 18
18 -
 19
19 -
 20
20 -
 21
21 -
 22
22 -
 23
23 -
 24
24 -
 25
25 -
 26
26 -
 27
27 -
 28
28 -
 29
29 -
 30
30 -
 31
31 -
 32
32 -
 33
33 -
 34
34 -
 35
35 -
 36
36 -
37
-
38
-
39
-
40
-
41
-
42
-
43
-
44
-
45
-
46
-
47
-
48
-
49
-
50
-
51
-
52
-
53
-
54
-
55
-
56
-
57
-
58
-
59
-
60
-
61
-
62
-
63
-
64
-
65
-
66
-
67
-
68
-
69
-
70
-
71
-
72
-
73
-
74
-
75
-
76
-
77
-
78
-
79
-
80
-
81
-
82
-
83
-
84
-
85
-
86
-
87
-
88
-
89
-
90
-
91
-
92
-
93
-
94
-
95
-
96
-
97
-
98
-
99
-
100
-
101
-
102
-
103
-
104
-
105
-
106
-
107
-
108
-
109
-
110
-
111
-
112
 |
 |
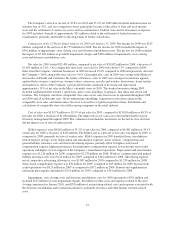
Impairments, store closing costs and division consolidation costs for 2008 amounted to $398 million and
included $211 million of asset impairment charges, $11 million of other costs and expenses related to the store
closings announced in January 2009, and $176 million of restructuring-related costs and expenses associated with
the division consolidation and localization initiatives, primarily severance and other human resource-related
costs.
Goodwill impairment charges for 2008 amounted to $5,382 million, which represented a write down of
goodwill in the amount of the excess of the previous carrying value of goodwill over the implied fair value of
goodwill, as calculated under the two-step goodwill impairment process in accordance with ASC Subtopic
350-20, “Goodwill.”
Net interest expense was $556 million for 2009, compared to $560 million for 2008, a decrease of $4
million. The decrease in net interest expense for 2009, as compared to 2008, resulted primarily from a lower
level of borrowings due to retirement of debt at maturity and the debt tender offer completed during 2009, and
was partially offset by a decrease in interest income due to lower rates on invested cash.
The Company’s effective income tax rate of 35.2% for 2009 differed from the federal income tax statutory
rate of 35.0% principally because of the effect of state and local income taxes and the settlement of various tax
issues and tax examinations. Federal, state and local income tax expense for 2009 included a benefit of
approximately $21 million related to the settlement of federal income tax examinations, primarily attributable to
the disposition of former subsidiaries. The Company’s effective income tax rate for 2008 differed from the
federal income tax statutory rate of 35.0%, principally because of the impact of non-deductible goodwill
impairment charges, the effect of state and local income taxes and the settlement of various tax issues and tax
examinations.
Liquidity and Capital Resources
The Company’s principal sources of liquidity are cash from operations, cash on hand and the credit facility
described below.
Net cash provided by operating activities in 2010 was $1,506 million, compared to $1,750 million provided
in 2009. The decrease in cash provided by operating activities in 2010 compared to 2009 includes a greater
decrease in other liabilities not separately identified, primarily accelerated pension contributions. During 2010,
the Company made pension funding contributions totaling approximately $825 million, compared to pension
funding contributions made during 2009 of approximately $370 million.
Net cash used by investing activities was $465 million for 2010, compared to net cash used by investing
activities of $377 million for 2009. Investing activities for 2010 include purchases of property and equipment
totaling $339 million and capitalized software of $166 million, compared to purchases of property and equipment
totaling $355 million and capitalized software of $105 million for 2009. Cash flows from investing activities
included $74 million and $60 million from the disposition of property and equipment for 2010 and 2009,
respectively.
The Company’s budgeted capital expenditures are approximately $800 million for 2011, primarily related to
store remodels, maintenance, technology and omnichannel investments, and distribution network improvements,
including construction of a new fulfillment center. Management presently anticipates funding such expenditures
with cash on hand and cash from operations.
Net cash used by the Company for all financing activities was $1,263 million for 2010, including the
repayment of $1,245 million of debt and the payment of $84 million of cash dividends, partially offset by an
increase in outstanding checks of $24 million and the issuance of $43 million of common stock, primarily related
20