Macy's 2010 Annual Report Download - page 3
Download and view the complete annual report
Please find page 3 of the 2010 Macy's annual report below. You can navigate through the pages in the report by either clicking on the pages listed below, or by using the keyword search tool below to find specific information within the annual report.-
 1
1 -
 2
2 -
 3
3 -
 4
4 -
 5
5 -
 6
6 -
 7
7 -
 8
8 -
 9
9 -
 10
10 -
 11
11 -
 12
12 -
 13
13 -
 14
14 -
15
-
16
-
17
-
18
-
19
-
20
-
21
-
22
-
23
-
24
-
25
-
26
-
27
-
28
-
29
-
30
-
31
-
32
-
33
-
34
-
35
-
36
-
37
-
38
-
39
-
40
-
41
-
42
-
43
-
44
-
45
-
46
-
47
-
48
-
49
-
50
-
51
-
52
-
53
-
54
-
55
-
56
-
57
-
58
-
59
-
60
-
61
-
62
-
63
-
64
-
65
-
66
-
67
-
68
-
69
-
70
-
71
-
72
-
73
-
74
-
75
-
76
-
77
-
78
-
79
-
80
-
81
-
82
-
83
-
84
-
85
-
86
-
87
-
88
-
89
-
90
-
91
-
92
-
93
-
94
-
95
-
96
-
97
-
98
-
99
-
100
-
101
-
102
-
103
-
104
-
105
-
106
-
107
-
108
-
109
-
110
-
111
-
112
 |
 |

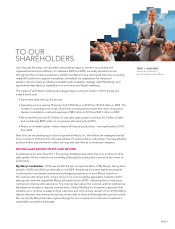
TERRY J. LUNDGREN
Chairman, President
and Chief Executive Officer
TO OUR
SHAREHOLDERS
Over the past five years, we have taken extraordinary steps to reinvent our business and
organizational structure at Macy’s, Inc. Between 2005 and 2009, we nearly doubled our size
through the May Company acquisition, transformed Macy’s into a nationwide brand by converting
nearly 600 stores from regional nameplates, centralized our organization for clarity and
speed in decision-making, adopted a breakthrough localization strategy called My Macy’s, and
significantly expanded our capabilities in e-commerce and digital marketing.
The impact of all of these fundamental changes began coming to fruition in 2010. Simply put,
it was a terrific year.
• Same-store sales were up 4.6 percent.
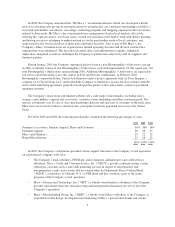
• Operating income rose by 78 percent to $1.894 billion in 2010 from $1.063 billion in 2009. The
increase in operating income was 32 percent, excluding asset impairment, store closing and
division consolidation costs and expenses of $25 million in 2010 and $391 million in 2009.
• We ended the year with $1.5 billion of cash after paying down more than $1.2 billion of debt
and contributing $825 million to our pension plan during scal 2010.
• Return on invested capital – a key measure of nancial productivity – rose signicantly in 2010
from 2009.
Best of all, we are developing a culture of growth at Macy’s, Inc. We believe the strategies that led
to our success in 2010 are still in the early phases of implementation, with plenty of runway ahead to
produce further improvements in sales, earnings and cash flow as our execution sharpens.
DRIVING SALES GROWTH IN 2011 AND BEYOND
In particular as we enter fiscal 2011, four primary strategies are positioning us to continue to drive
sales growth. All are rooted in our overriding philosophy for putting the customer at the center of
all decisions.
My Macy’s Localization – 2010 was the rst full year of implementation of My Macy’s, having been
piloted in 2008 and rolled out nationally in mid-2009. Already, we have seen signicant progress
in tailoring the merchandise assortment and shopping experience in each Macy’s location to
the customer who shops there. In fact, some of our most successful geographic markets in 2010
sales growth were the original My Macy’s pilot districts from 2008 – indicating that our execution
continues to improve with experience. The more we learn about the customer and her preferences,
the better we are able to respond store-by-store. Clearly, My Macy’s is a long-term approach that
will allow us to continue to adapt to local customers and communities. As each of our 69 My Macy’s
districts discovers new avenues for success, we are able to share and leverage best practices across
the country. My Macy’s has been a game-changer for our company and continues to represent a
sustainable competitive advantage.
PAGE 1