Macy's 2010 Annual Report Download - page 65
Download and view the complete annual report
Please find page 65 of the 2010 Macy's annual report below. You can navigate through the pages in the report by either clicking on the pages listed below, or by using the keyword search tool below to find specific information within the annual report.-
 1
1 -
2
-
3
-
4
-
5
-
6
-
7
-
8
-
9
-
10
-
11
-
12
-
13
-
14
-
15
-
16
-
17
-
18
-
19
-
20
-
21
-
22
-
23
-
24
-
25
-
26
-
27
-
28
-
29
-
30
-
31
-
32
-
33
-
34
-
35
-
36
-
37
-
38
-
39
-
40
-
41
-
42
-
43
-
44
-
45
-
46
-
47
-
48
-
49
-
50
-
51
-
52
-
53
-
54
-
 55
55 -
 56
56 -
 57
57 -
 58
58 -
 59
59 -
 60
60 -
 61
61 -
 62
62 -
 63
63 -
 64
64 -
 65
65 -
 66
66 -
 67
67 -
 68
68 -
 69
69 -
 70
70 -
 71
71 -
 72
72 -
 73
73 -
 74
74 -
 75
75 -
76
-
77
-
78
-
79
-
80
-
81
-
82
-
83
-
84
-
85
-
86
-
87
-
88
-
89
-
90
-
91
-
92
-
93
-
94
-
95
-
96
-
97
-
98
-
99
-
100
-
101
-
102
-
103
-
104
-
105
-
106
-
107
-
108
-
109
-
110
-
111
-
112
 |
 |

NOTES TO CONSOLIDATED FINANCIAL STATEMENTS — (Continued)
estimates and judgments. Both the estimates of the fair value of the Company’s reporting units and the allocation
of the estimated fair value of the reporting units to their net assets are based on the best information available to
the Company’s management as of the date of the assessment.
The use of different assumptions, estimates or judgments in either step of the goodwill impairment testing
process, including with respect to the estimated future cash flows of the Company’s reporting units, the discount
rate used to discount such estimated cash flows to their net present value, the reasonableness of the resultant
implied control premium relative to the Company’s market capitalization, and the appraised fair value of the
reporting units’ tangible and intangible assets and liabilities, could materially increase or decrease the fair value
of the reporting unit and/or its net assets and, accordingly, could materially increase or decrease any related
impairment charge.
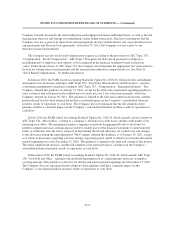
4. Receivables
Receivables were $392 million at January 29, 2011, compared to $358 million at January 30, 2010.
In connection with the sales of credit card accounts and related receivable balances, the Company and
Citibank entered into a long-term marketing and servicing alliance pursuant to the terms of a Credit Card
Program Agreement (the “Program Agreement”) with an initial term of 10 years expiring on July 17, 2016 and,
unless terminated by either party as of the expiration of the initial term, an additional renewal term of three
years. The Program Agreement provides for, among other things, (i) the ownership by Citibank of the accounts
purchased by Citibank, (ii) the ownership by Citibank of new accounts opened by the Company’s customers,
(iii) the provision of credit by Citibank to the holders of the credit cards associated with the foregoing accounts,
(iv) the servicing of the foregoing accounts, and (v) the allocation between Citibank and the Company of the
economic benefits and burdens associated with the foregoing and other aspects of the alliance.
Pursuant to the Program Agreement, the Company continues to provide certain servicing functions related to
the accounts and related receivables owned by Citibank and receives compensation from Citibank for these
services. The amounts earned under the Program Agreement related to the servicing functions are deemed
adequate compensation and, accordingly, no servicing asset or liability has been recorded on the Consolidated
Balance Sheets.
Amounts received under the Program Agreement were $528 million for 2010, $525 million for 2009 and
$594 million for 2008, and are treated as reductions of SG&A expenses on the Consolidated Statements of
Operations. The Company’s earnings from credit operations, net of servicing expenses, were $332 million for
2010, $323 million for 2009, and $372 million for 2008.
5. Inventories
Merchandise inventories were $4,758 million at January 29, 2011, compared to $4,615 million at
January 30, 2010. At these dates, the cost of inventories using the LIFO method approximated the cost of such
inventories using the FIFO method. The application of the LIFO method did not impact cost of sales for 2010,
2009 or 2008.
F-17