Kraft 2008 Annual Report Download - page 83
Download and view the complete annual report
Please find page 83 of the 2008 Kraft annual report below. You can navigate through the pages in the report by either clicking on the pages listed below, or by using the keyword search tool below to find specific information within the annual report.-
 1
1 -
2
-
3
-
4
-
5
-
6
-
7
-
8
-
9
-
10
-
11
-
12
-
13
-
14
-
15
-
16
-
17
-
18
-
19
-
20
-
21
-
22
-
23
-
24
-
25
-
26
-
27
-
28
-
29
-
30
-
31
-
32
-
33
-
34
-
35
-
36
-
37
-
38
-
39
-
40
-
41
-
42
-
43
-
44
-
45
-
46
-
47
-
48
-
49
-
50
-
51
-
52
-
53
-
54
-
55
-
56
-
57
-
58
-
59
-
60
-
61
-
62
-
63
-
64
-
65
-
66
-
67
-
68
-
69
-
70
-
71
-
72
-
 73
73 -
 74
74 -
 75
75 -
 76
76 -
 77
77 -
 78
78 -
 79
79 -
 80
80 -
 81
81 -
 82
82 -
 83
83 -
 84
84 -
 85
85 -
 86
86 -
 87
87 -
 88
88 -
 89
89 -
 90
90 -
 91
91 -
 92
92 -
 93
93 -
94
-
95
-
96
-
97
-
98
-
99
-
100
-
101
-
102
-
103
-
104
-
105
-
106
-
107
-
108
-
109
-
110
-
111
-
112
-
113
-
114
-
115
-
116
-
117
-
118
-
119
-
120
-
121
-
122
-
123
-
124
-
125
-
126
-
127
-
128
-
129
 |
 |

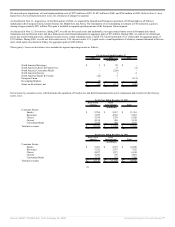
Geographic data for net revenues, total assets and long-lived assets (which consist of all non-current assets, other than goodwill, intangible assets, net, and
prepaid pension assets) were:
For the Years Ended December 31,
2007 2006 2005
(in millions)
Net revenues:
United States $ 21,543 $ 20,931 $ 21,054
Europe 9,384 7,817 7,678
Other 6,314 5,608 5,381
Total net revenues $ 37,241 $ 34,356 $ 34,113
Total assets:
United States $ 38,296 $ 37,981 $ 42,851
Europe 21,039 11,420 9,935
Other 8,658 6,173 4,842
Total assets $ 67,993 $ 55,574 $ 57,628
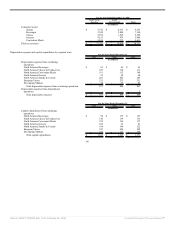
Long-lived assets:
United States $ 6,075 $ 5,885 $ 6,153
Europe 3,653 2,528 2,663
Other 2,487 2,009 1,878
Total long-lived assets $ 12,215 $ 10,422 $ 10,694
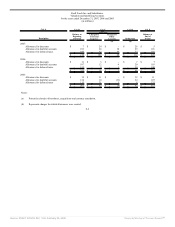
Note 17. Quarterly Financial Data (Unaudited):
2007 Quarters
First Second Third Fourth
(in millions, except per share data)
Net revenues $ 8,586 $ 9,205 $ 9,054 $ 10,396
Gross profit $ 3,051 $ 3,260 $ 3,059 $ 3,220
Net earnings $ 702 $ 707 $ 596 $ 585
Weighted average shares for diluted EPS 1,636 1,606 1,576 1,552
Per share data:
Basic EPS $ 0.43 $ 0.45 $ 0.38 $ 0.38
Diluted EPS $ 0.43 $ 0.44 $ 0.38 $ 0.38
Dividends declared $ 0.25 $ 0.25 $ 0.27 $ 0.27
Market price - high $ 36.26 $ 37.20 $ 36.85 $ 35.29
- low $ 29.95 $ 30.18 $ 30.51 $ 32.09
2006 Quarters
First Second Third Fourth
(in millions, except per share data)
Net revenues $ 8,123 $ 8,619 $ 8,243 $ 9,371
Gross profit $ 2,932 $ 3,184 $ 3,000 $ 3,300
Net earnings $ 1,006 $ 682 $ 748 $ 624
Weighted average shares for diluted EPS 1,662 1,656 1,648 1,642
Per share data:
Basic EPS $ 0.61 $ 0.41 $ 0.46 $ 0.38
Diluted EPS $ 0.61 $ 0.41 $ 0.45 $ 0.38
Dividends declared $ 0.23 $ 0.23 $ 0.25 $ 0.25
Market price - high $ 31.25 $ 33.31 $ 36.47 $ 36.67
- low $ 27.44 $ 28.97 $ 29.50 $ 33.48
81
Source: KRAFT FOODS INC, 10-K, February 25, 2008 Powered by Morningstar® Document Research℠