Kraft 2008 Annual Report Download - page 81
Download and view the complete annual report
Please find page 81 of the 2008 Kraft annual report below. You can navigate through the pages in the report by either clicking on the pages listed below, or by using the keyword search tool below to find specific information within the annual report.-
 1
1 -
2
-
3
-
4
-
5
-
6
-
7
-
8
-
9
-
10
-
11
-
12
-
13
-
14
-
15
-
16
-
17
-
18
-
19
-
20
-
21
-
22
-
23
-
24
-
25
-
26
-
27
-
28
-
29
-
30
-
31
-
32
-
33
-
34
-
35
-
36
-
37
-
38
-
39
-
40
-
41
-
42
-
43
-
44
-
45
-
46
-
47
-
48
-
49
-
50
-
51
-
52
-
53
-
54
-
55
-
56
-
57
-
58
-
59
-
60
-
61
-
62
-
63
-
64
-
65
-
66
-
67
-
68
-
69
-
70
-
 71
71 -
 72
72 -
 73
73 -
 74
74 -
 75
75 -
 76
76 -
 77
77 -
 78
78 -
 79
79 -
 80
80 -
 81
81 -
 82
82 -
 83
83 -
 84
84 -
 85
85 -
 86
86 -
 87
87 -
 88
88 -
 89
89 -
 90
90 -
 91
91 -
92
-
93
-
94
-
95
-
96
-
97
-
98
-
99
-
100
-
101
-
102
-
103
-
104
-
105
-
106
-
107
-
108
-
109
-
110
-
111
-
112
-
113
-
114
-
115
-
116
-
117
-
118
-
119
-
120
-
121
-
122
-
123
-
124
-
125
-
126
-
127
-
128
-
129
 |
 |

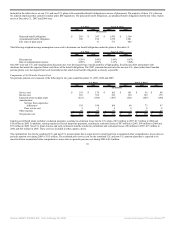
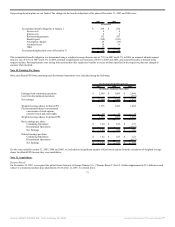
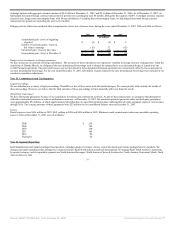
We incurred asset impairment, exit and implementation costs of $579 million in 2007, $1,097 million in 2006, and $566 million in 2005. Refer to Note 2, Asset
Impairment, Exit and Implementation Costs, for a breakout of charges by segment.
As described in Note 11. Acquisitions, in the third quarter of 2006, we acquired the Spanish and Portuguese operations of UB and rights to all Nabisco
trademarks in the European Union, Eastern Europe, the Middle East and Africa. The redemption of our outstanding investment in UB resulted in a gain on
closing of approximately $251 million. This gain is included in segment operating income of the European Union segment.
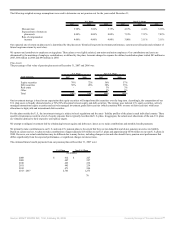
As discussed in Note 12. Divestitures, during 2007, we sold our hot cereal assets and trademarks, our sugar confectionery assets in Romania and related
trademarks and our flavored water and juice brand assets and related trademarks for aggregate gains of $15 million. During 2006, we sold our rice brand and
assets, pet snacks brand and assets, industrial coconut assets, certain Canadian assets, a small U.S. biscuit brand and a U.S. coffee plant for aggregate gains of
$117 million. During 2005, we sold our fruit snacks assets, U.K. desserts assets, U.S. yogurt assets, a small operation in Colombia, a minor trademark in Mexico
and a small equity investment in Turkey for aggregate gains of $108 million.
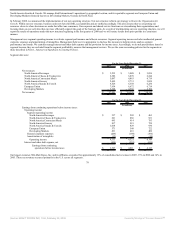
These (gains) / losses on divestitures were included in segment operating income as follows:
For the Years Ended December 31,
2007 2006 2005
(in millions)
North America Beverages $ 5 $ 95 $ -
North America Cheese & Foodservice - 8 (1)
North America Convenient Meals - (226) -
North America Grocery - 1 2
North America Snacks & Cereals (12) 5 -
European Union - - (114)
Developing Markets (8) - 5
Gains on divestitures, net $ (15) $ (117) $ (108)
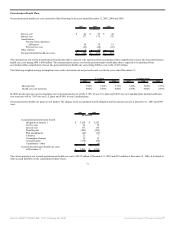
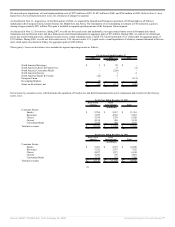
Net revenues by consumer sector, which includes the separation of Foodservice and Kraft International into sector components and Cereals into the Grocery
sector, were:
For the Year Ended December 31, 2007
Kraft North
America
Kraft
International Total
(in millions)
Consumer Sector:
Snacks $ 5,704 $ 5,657 $ 11,361
Beverages 3,499 4,562 8,061
Cheese 5,199 1,729 6,928
Grocery 4,198 926 5,124
Convenient Meals 5,339 428 5,767
Total net revenues $ 23,939 $ 13,302 $ 37,241
For the Year Ended December 31, 2006
Kraft North
America
Kraft
International Total
(in millions)
Consumer Sector:
Snacks $ 5,491 $ 4,537 $ 10,028
Beverages 3,352 3,973 7,325
Cheese 4,857 1,557 6,414
Grocery 4,282 799 5,081
Convenient Meals 5,136 372 5,508
Total net revenues $ 23,118 $ 11,238 $ 34,356
79
Source: KRAFT FOODS INC, 10-K, February 25, 2008 Powered by Morningstar® Document Research℠