Kraft 2008 Annual Report Download - page 18
Download and view the complete annual report
Please find page 18 of the 2008 Kraft annual report below. You can navigate through the pages in the report by either clicking on the pages listed below, or by using the keyword search tool below to find specific information within the annual report.-
 1
1 -
2
-
3
-
4
-
5
-
6
-
7
-
 8
8 -
 9
9 -
 10
10 -
 11
11 -
 12
12 -
 13
13 -
 14
14 -
 15
15 -
 16
16 -
 17
17 -
 18
18 -
 19
19 -
 20
20 -
 21
21 -
 22
22 -
 23
23 -
 24
24 -
 25
25 -
 26
26 -
 27
27 -
 28
28 -
29
-
30
-
31
-
32
-
33
-
34
-
35
-
36
-
37
-
38
-
39
-
40
-
41
-
42
-
43
-
44
-
45
-
46
-
47
-
48
-
49
-
50
-
51
-
52
-
53
-
54
-
55
-
56
-
57
-
58
-
59
-
60
-
61
-
62
-
63
-
64
-
65
-
66
-
67
-
68
-
69
-
70
-
71
-
72
-
73
-
74
-
75
-
76
-
77
-
78
-
79
-
80
-
81
-
82
-
83
-
84
-
85
-
86
-
87
-
88
-
89
-
90
-
91
-
92
-
93
-
94
-
95
-
96
-
97
-
98
-
99
-
100
-
101
-
102
-
103
-
104
-
105
-
106
-
107
-
108
-
109
-
110
-
111
-
112
-
113
-
114
-
115
-
116
-
117
-
118
-
119
-
120
-
121
-
122
-
123
-
124
-
125
-
126
-
127
-
128
-
129
 |
 |
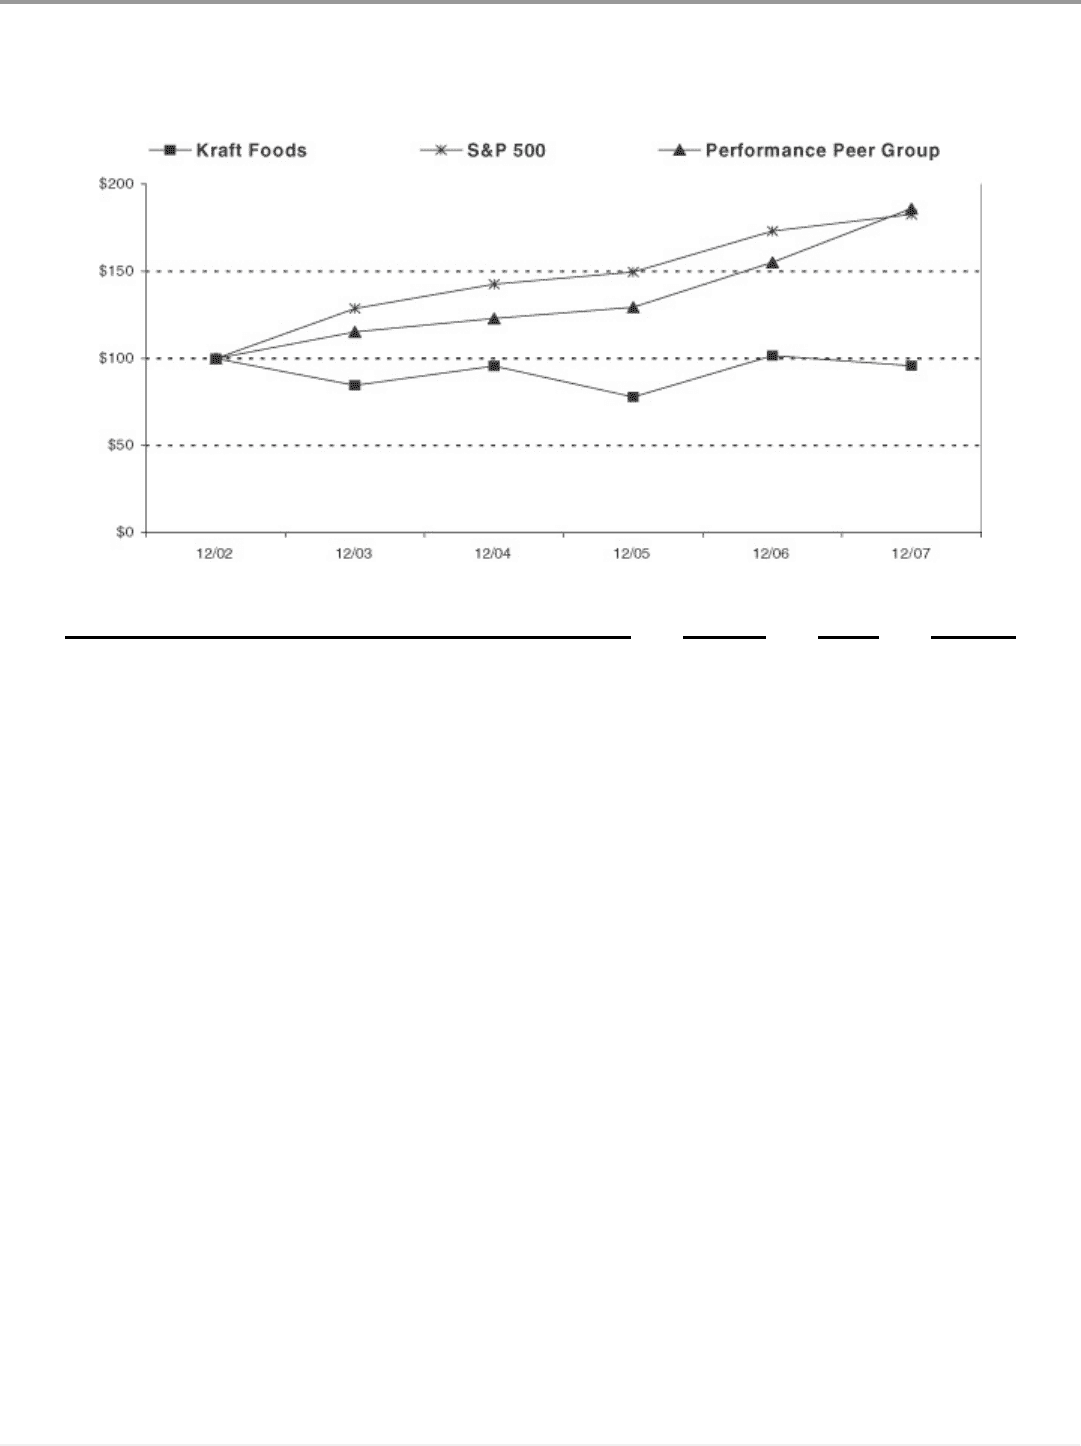
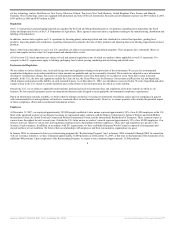
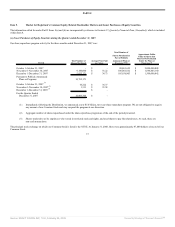
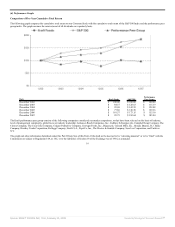
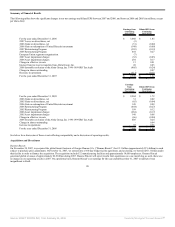
(d) Performance Graph.
Comparison of Five-Year Cumulative Total Return
The following graph compares the cumulative total return on our Common Stock with the cumulative total return of the S&P 500 Index and the performance peer
group index. The graph assumes the reinvestment of all dividends on a quarterly basis.
Date Kraft Foods S&P 500
Performance
Peer Group
December 2002 $ 100.00 $ 100.00 $ 100.00
December 2003 $ 84.57 $ 128.63 $ 115.19
December 2004 $ 95.68 $ 142.59 $ 122.98
December 2005 $ 77.86 $ 149.58 $ 129.36
December 2006 $ 101.57 $ 173.15 $ 155.10
December 2007 $ 95.75 $ 182.64 $ 185.94
The Kraft performance peer group consists of the following companies considered our market competitors, or that have been selected on the basis of industry,
level of management complexity, global focus or industry leadership: Anheuser-Busch Companies, Inc., Cadbury Schweppes plc, Campbell Soup Company, The
Clorox Company, The Coca-Cola Company, Colgate-Palmolive Company, ConAgra Foods, Inc., Diageo plc, General Mills, Inc., Groupe Danone, H.J. Heinz
Company, Hershey Foods Corporation, Kellogg Company, Nestlé S.A., PepsiCo, Inc., The Procter & Gamble Company, Sara Lee Corporation, and Unilever
N.V.
The graph and other information furnished under this Part II Item 5(a) of this Form 10-K shall not be deemed to be “soliciting material” or to be “filed” with the
Commission or subject to Regulation 14A or 14C, or to the liabilities of Section 18 of the Exchange Act of 1934, as amended.
16
Source: KRAFT FOODS INC, 10-K, February 25, 2008 Powered by Morningstar® Document Research℠