Kraft 2008 Annual Report Download - page 72
Download and view the complete annual report
Please find page 72 of the 2008 Kraft annual report below. You can navigate through the pages in the report by either clicking on the pages listed below, or by using the keyword search tool below to find specific information within the annual report.-
 1
1 -
2
-
3
-
4
-
5
-
6
-
7
-
8
-
9
-
10
-
11
-
12
-
13
-
14
-
15
-
16
-
17
-
18
-
19
-
20
-
21
-
22
-
23
-
24
-
25
-
26
-
27
-
28
-
29
-
30
-
31
-
32
-
33
-
34
-
35
-
36
-
37
-
38
-
39
-
40
-
41
-
42
-
43
-
44
-
45
-
46
-
47
-
48
-
49
-
50
-
51
-
52
-
53
-
54
-
55
-
56
-
57
-
58
-
59
-
60
-
61
-
 62
62 -
 63
63 -
 64
64 -
 65
65 -
 66
66 -
 67
67 -
 68
68 -
 69
69 -
 70
70 -
 71
71 -
 72
72 -
 73
73 -
 74
74 -
 75
75 -
 76
76 -
 77
77 -
 78
78 -
 79
79 -
 80
80 -
 81
81 -
 82
82 -
83
-
84
-
85
-
86
-
87
-
88
-
89
-
90
-
91
-
92
-
93
-
94
-
95
-
96
-
97
-
98
-
99
-
100
-
101
-
102
-
103
-
104
-
105
-
106
-
107
-
108
-
109
-
110
-
111
-
112
-
113
-
114
-
115
-
116
-
117
-
118
-
119
-
120
-
121
-
122
-
123
-
124
-
125
-
126
-
127
-
128
-
129
 |
 |

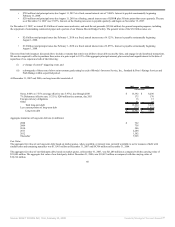
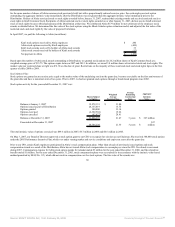
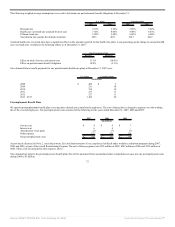
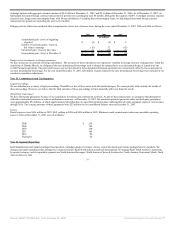
The following weighted-average assumptions were used to determine our net pension cost for the years ended December 31:
U.S. Plans Non-U.S. Plans
2007 2006 2005 2007 2006 2005
Discount rate 5.90% 5.60% 5.75% 4.67% 4.44% 5.18%
Expected rate of return on
plan assets 8.00% 8.00% 8.00% 7.53% 7.57% 7.82%
Rate of compensation
increase 4.00% 4.00% 4.00% 3.00% 3.11% 3.11%
Our expected rate of return on plan assets is determined by the plan assets’ historical long-term investment performance, current asset allocation and estimates of
future long-term returns by asset class.
We sponsor and contribute to employee savings plans. These plans cover eligible salaried, non-union and union employees. Our contributions and costs are
determined by the matching of employee contributions, as defined by the plans. Amounts charged to expense for defined contribution plans totaled $83 million in
2007, $84 million in 2006 and $94 million in 2005.
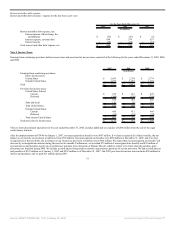
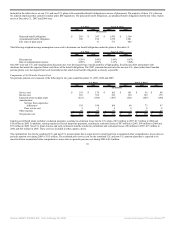
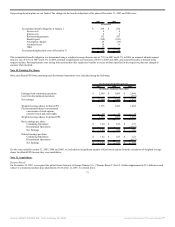
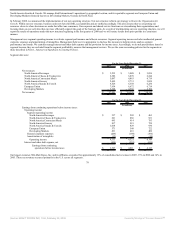
Plan Assets:
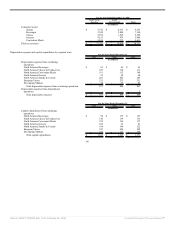
The percentage of fair value of pension plan assets at December 31, 2007 and 2006 was:
U.S. Plans Non-U.S. Plans
Asset Category 2007 2006 2007 2006
Equity securities 70% 72% 56% 57%
Debt securities 30% 28% 38% 35%
Real estate - - 3% 3%
Other - - 3% 5%
Total 100% 100% 100% 100%
Our investment strategy is based on an expectation that equity securities will outperform debt securities over the long term. Accordingly, the composition of our
U.S. plan assets is broadly characterized as a 70%/30% allocation between equity and debt securities. The strategy uses indexed U.S. equity securities, actively
managed international equity securities and actively managed investment grade debt securities (which constitute 80% or more of debt securities) with lesser
allocations to high yield and international debt securities.
For the plans outside the U.S., the investment strategy is subject to local regulations and the asset / liability profiles of the plans in each individual country. These
specific circumstances result in a level of equity exposure that is typically less than the U.S. plans. In aggregate, the actual asset allocations of the non-U.S. plans
are virtually identical to their respective asset policy targets.
We attempt to mitigate investment risk by rebalancing between equity and debt asset classes as we make contributions and monthly benefit payments.
We primarily make contributions to our U.S. and non-U.S. pension plans to the extent that they are tax deductible and do not generate an excise tax liability.
Based on current tax law, we plan to make contributions of approximately $15 million to our U.S. plans and approximately $160 million to our non-U.S. plans in
2008. However, our actual contributions may be different due to many factors, including changes in tax and other benefit laws, pension asset performance that
differs significantly from the expected performance, or significant changes in interest rates.
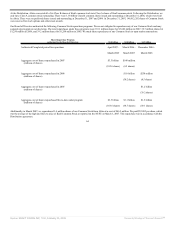
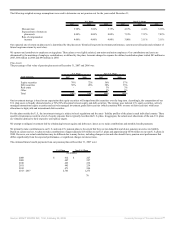
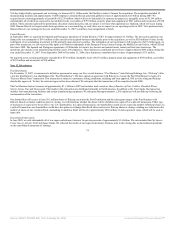
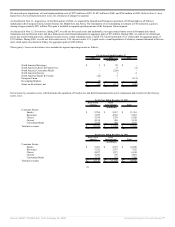
The estimated future benefit payments from our pension plans at December 31, 2007 were:
U.S. Plans Non-U.S. Plans
(in millions)
2008 $ 412 $ 227
2009 407 227
2010 425 232
2011 445 239
2012 471 244
2013 - 2017 2,743 1,275
70
Source: KRAFT FOODS INC, 10-K, February 25, 2008 Powered by Morningstar® Document Research℠