Kraft 2008 Annual Report Download - page 26
Download and view the complete annual report
Please find page 26 of the 2008 Kraft annual report below. You can navigate through the pages in the report by either clicking on the pages listed below, or by using the keyword search tool below to find specific information within the annual report.-
 1
1 -
2
-
3
-
4
-
5
-
6
-
7
-
8
-
9
-
10
-
11
-
12
-
13
-
14
-
15
-
 16
16 -
 17
17 -
 18
18 -
 19
19 -
 20
20 -
 21
21 -
 22
22 -
 23
23 -
 24
24 -
 25
25 -
 26
26 -
 27
27 -
 28
28 -
 29
29 -
 30
30 -
 31
31 -
 32
32 -
 33
33 -
 34
34 -
 35
35 -
 36
36 -
37
-
38
-
39
-
40
-
41
-
42
-
43
-
44
-
45
-
46
-
47
-
48
-
49
-
50
-
51
-
52
-
53
-
54
-
55
-
56
-
57
-
58
-
59
-
60
-
61
-
62
-
63
-
64
-
65
-
66
-
67
-
68
-
69
-
70
-
71
-
72
-
73
-
74
-
75
-
76
-
77
-
78
-
79
-
80
-
81
-
82
-
83
-
84
-
85
-
86
-
87
-
88
-
89
-
90
-
91
-
92
-
93
-
94
-
95
-
96
-
97
-
98
-
99
-
100
-
101
-
102
-
103
-
104
-
105
-
106
-
107
-
108
-
109
-
110
-
111
-
112
-
113
-
114
-
115
-
116
-
117
-
118
-
119
-
120
-
121
-
122
-
123
-
124
-
125
-
126
-
127
-
128
-
129
 |
 |

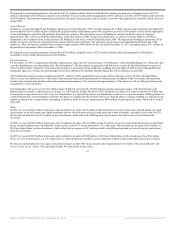
Provision for Income Taxes
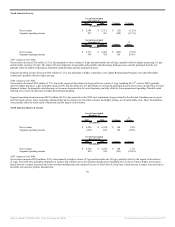
Our tax rate was 30.5% in 2007, 23.7% in 2006 and 29.4% in 2005. Our 2007 effective tax rate includes $184 million in favorable tax rate items, primarily
including the effects of dividend repatriation benefits, foreign earnings taxed below the U.S. federal statutory tax rate, foreign joint venture earnings, and the
effect on foreign deferred taxes from lower foreign tax rates enacted in 2007, partially offset by other foreign tax expense items. The 2007 tax rate also benefited
from an increased domestic manufacturing deduction and the divestiture of our flavored water and juice brand assets and related trademarks. These benefits were
partially offset by state tax expense.
During 2006, the IRS concluded its examination of Altria’s consolidated tax returns for the years 1996 through 1999. The IRS issued a final Revenue Agents
Report on March 15, 2006. Consequently, Altria reimbursed us $337 million for federal tax reserves that were no longer necessary and $46 million for interest
($29 million net of tax). We also recognized net state tax reversals of $39 million, for a total tax provision benefit of $376 million ($337 million federal plus $39
million state). The total benefit to net earnings that we recognized in 2006 due to the IRS settlement was $405 million, or $0.24 per diluted share. The 2006 tax
rate also benefited from the resolution of various tax items in our foreign operations, dividend repatriation benefits, joint venture earnings, and lower foreign tax
rates enacted in 2006 (primarily Canada). These benefits were partially offset by state tax expense and by the tax costs associated with our 2006 divestitures.
The 2005 effective tax rate includes tax benefits of $117 million from dividend repatriation including the impact from the American Jobs Creation Act of 2004,
the resolution of outstanding items in our international operations, and the settlement of an outstanding U.S. tax claim. The 2005 tax rate also benefited from our
2005 divestitures, which was partially offset by state tax expense.
As discussed in Note 1, Summary of Significant Accounting Policies, Altria transferred our federal tax contingencies of $375 million to our balance sheet and
related interest income of $77 million, or $0.03 per diluted share, as a result of the Distribution. Following the Distribution, we are no longer a member of the
Altria consolidated tax return group, and we will file our own federal consolidated income tax return. We continue to assess opportunities to mitigate the loss of
tax benefits as a result of filing separately, and currently estimate the annual amount of lost tax benefits to be in the range of $50 million to $75 million, as
compared to 2007.
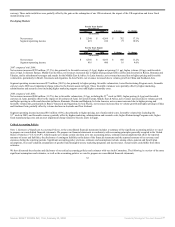
Consolidated Results of Operations
The following discussion compares our consolidated operating results for 2007 with 2006, and for 2006 with 2005.
Many factors impact the timing of sales to our customers. These factors include, among others, the timing of holidays and other annual or special events,
seasonality, significant weather conditions, timing of our own or customer incentive programs and pricing actions, customer inventory programs and general
economic conditions. Our domestic operating subsidiaries report year-end results as of the Saturday closest to the end of each year, and our international
operating subsidiaries generally report year-end results two weeks prior to the Saturday closest to the end of each year. This resulted in 53 weeks of operating
results in our consolidated statement of earnings for the year ended December 31, 2005, versus 52 weeks for the years ended December 31, 2007 and 2006.
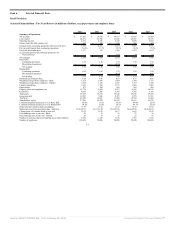
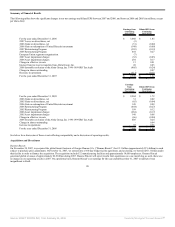
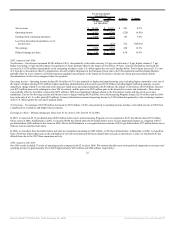
For the Years Ended
December 31,
$ change
% change
2007 2006
(in millions, except
per share data)
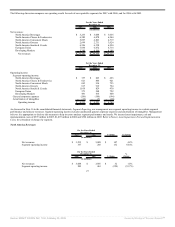
Net revenues $ 37,241 $ 34,356 $ 2,885 8.4%
Operating income 4,331 4,521 (190) (4.2%)
Net earnings 2,590 3,060 (470) (15.4%)
Diluted earnings per share $ 1.62 $ 1.85 (0.23) (12.4%)
24
Source: KRAFT FOODS INC, 10-K, February 25, 2008 Powered by Morningstar® Document Research℠