Kraft 2008 Annual Report Download - page 74
Download and view the complete annual report
Please find page 74 of the 2008 Kraft annual report below. You can navigate through the pages in the report by either clicking on the pages listed below, or by using the keyword search tool below to find specific information within the annual report.-
 1
1 -
2
-
3
-
4
-
5
-
6
-
7
-
8
-
9
-
10
-
11
-
12
-
13
-
14
-
15
-
16
-
17
-
18
-
19
-
20
-
21
-
22
-
23
-
24
-
25
-
26
-
27
-
28
-
29
-
30
-
31
-
32
-
33
-
34
-
35
-
36
-
37
-
38
-
39
-
40
-
41
-
42
-
43
-
44
-
45
-
46
-
47
-
48
-
49
-
50
-
51
-
52
-
53
-
54
-
55
-
56
-
57
-
58
-
59
-
60
-
61
-
62
-
63
-
 64
64 -
 65
65 -
 66
66 -
 67
67 -
 68
68 -
 69
69 -
 70
70 -
 71
71 -
 72
72 -
 73
73 -
 74
74 -
 75
75 -
 76
76 -
 77
77 -
 78
78 -
 79
79 -
 80
80 -
 81
81 -
 82
82 -
 83
83 -
 84
84 -
85
-
86
-
87
-
88
-
89
-
90
-
91
-
92
-
93
-
94
-
95
-
96
-
97
-
98
-
99
-
100
-
101
-
102
-
103
-
104
-
105
-
106
-
107
-
108
-
109
-
110
-
111
-
112
-
113
-
114
-
115
-
116
-
117
-
118
-
119
-
120
-
121
-
122
-
123
-
124
-
125
-
126
-
127
-
128
-
129
 |
 |

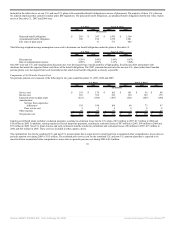
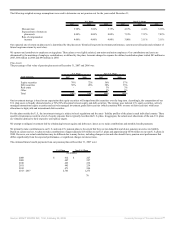
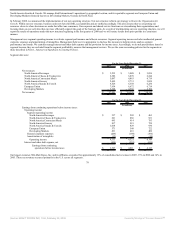
The following weighted-average assumptions were used to determine our postretirement benefit obligations at December 31:
U.S. Plans Canadian Plans
2007 2006 2007 2006
Discount rate 6.10% 5.90% 5.80% 5.00%
Health care cost trend rate assumed for next year 7.50% 8.00% 9.00% 8.50%
Ultimate trend rate 5.00% 5.00% 6.00% 6.00%
Year that the rate reaches the ultimate trend rate 2013 2011 2013 2012
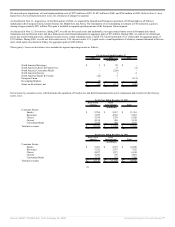
Assumed health care cost trend rates have a significant effect on the amounts reported for the health care plans. A one-percentage-point change in assumed health
care cost trend rates would have the following effects as of December 31, 2007:
One-Percentage-Point
Increase Decrease
Effect on total of service and interest cost 13.3% (10.9%)
Effect on postretirement benefit obligation 10.8% (9.1%)
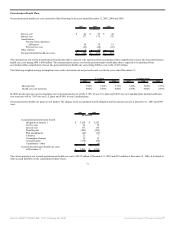
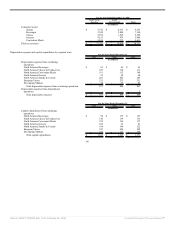
Our estimated future benefit payments for our postretirement health care plans at December 31, 2007 were:
U.S. Plans Canadian Plans
(in millions)
2008 $ 208 $ 9
2009 211 10
2010 214 10
2011 217 11
2012 217 11
2013 - 2017 1,102 60
Postemployment Benefit Plans
We sponsor postemployment benefit plans covering most salaried and certain hourly employees. The cost of these plans is charged to expense over the working
life of the covered employees. Net postemployment costs consisted of the following for the years ended December 31, 2007, 2006 and 2005:
2007 2006 2005
(in millions)
Service cost $ 4 $ 4 $ 7
Interest cost 6 4 -
Amortization of net gains (2) (7) (7)
Other expense 132 236 139
Net postemployment costs $ 140 $ 237 $ 139
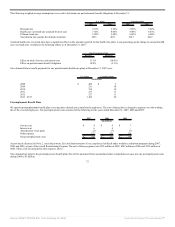
As previously discussed in Note 2, Asset Impairment, Exit and Implementation Costs, employees left Kraft under workforce reduction programs during 2007,
2006 and 2005, as part of the overall Restructuring Program. The cost of these programs was $132 million in 2007, $247 million in 2006 and $139 million in
2005. These costs are included in other expense, above.
The estimated net gain for the postemployment benefit plans that will be amortized from accumulated other comprehensive losses into net postemployment costs
during 2008 is $3 million.
72
Source: KRAFT FOODS INC, 10-K, February 25, 2008 Powered by Morningstar® Document Research℠