Kraft 2008 Annual Report Download - page 80
Download and view the complete annual report
Please find page 80 of the 2008 Kraft annual report below. You can navigate through the pages in the report by either clicking on the pages listed below, or by using the keyword search tool below to find specific information within the annual report.-
 1
1 -
2
-
3
-
4
-
5
-
6
-
7
-
8
-
9
-
10
-
11
-
12
-
13
-
14
-
15
-
16
-
17
-
18
-
19
-
20
-
21
-
22
-
23
-
24
-
25
-
26
-
27
-
28
-
29
-
30
-
31
-
32
-
33
-
34
-
35
-
36
-
37
-
38
-
39
-
40
-
41
-
42
-
43
-
44
-
45
-
46
-
47
-
48
-
49
-
50
-
51
-
52
-
53
-
54
-
55
-
56
-
57
-
58
-
59
-
60
-
61
-
62
-
63
-
64
-
65
-
66
-
67
-
68
-
69
-
 70
70 -
 71
71 -
 72
72 -
 73
73 -
 74
74 -
 75
75 -
 76
76 -
 77
77 -
 78
78 -
 79
79 -
 80
80 -
 81
81 -
 82
82 -
 83
83 -
 84
84 -
 85
85 -
 86
86 -
 87
87 -
 88
88 -
 89
89 -
 90
90 -
91
-
92
-
93
-
94
-
95
-
96
-
97
-
98
-
99
-
100
-
101
-
102
-
103
-
104
-
105
-
106
-
107
-
108
-
109
-
110
-
111
-
112
-
113
-
114
-
115
-
116
-
117
-
118
-
119
-
120
-
121
-
122
-
123
-
124
-
125
-
126
-
127
-
128
-
129
 |
 |

North America Snacks & Cereals. We manage Kraft International’s operations by geographic location, and its reportable segments are European Union and
Developing Markets (formerly known as Developing Markets, Oceania & North Asia).
In February 2008, we announced the implementation of our new operating structure. Our new structure reflects our strategy to Rewire the Organization for
Growth. Within our new structure, business units now have full P&L accountability and are staffed accordingly. This also ensures that we are putting our
resources closer to where decisions are made that affect our consumers. Our corporate and shared service functions are streamlining their organizations and
focusing them on core activities that can more efficiently support the goals of the business units. As a result of implementing our new operating structure, we will
report the results of operations under this new structure beginning in the first quarter of 2008 and we will restate results from prior periods in a consistent
manner.
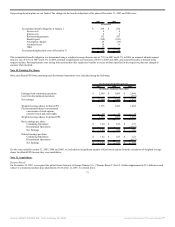
Management uses segment operating income to evaluate segment performance and allocate resources. Segment operating income excludes unallocated general
corporate expenses and amortization of intangibles. Management believes it is appropriate to disclose this measure to help investors analyze segment
performance and trends. We centrally manage interest and other debt expense and the provision for income taxes. Accordingly, we do not present these items by
segment because they are excluded from the segment profitability measure that management reviews. We use the same accounting policies for the segments as
those described in Note 1, Summary of Significant Accounting Policies.
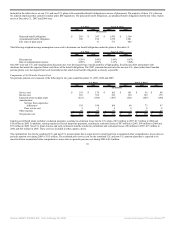
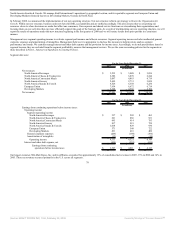
Segment data were:
For the Years Ended December 31,
2007 2006 2005
(in millions)
Net revenues:
North America Beverages $ 3,235 $ 3,088 $ 3,056
North America Cheese & Foodservice 6,382 6,078 6,244
North America Convenient Meals 5,097 4,863 4,719
North America Grocery 2,699 2,731 3,024
North America Snacks & Cereals 6,526 6,358 6,250
European Union 7,954 6,672 6,714
Developing Markets 5,348 4,566 4,106
Net revenues $ 37,241 $ 34,356 $ 34,113
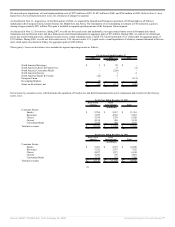
For the Years Ended December 31,
2007 2006 2005
(in millions)
Earnings from continuing operations before income taxes:
Operating income:
Segment operating income:
North America Beverages $ 337 $ 205 $ 463
North America Cheese & Foodservice 621 886 921
North America Convenient Meals 695 914 793
North America Grocery 817 919 724
North America Snacks & Cereals 1,018 829 930
European Union 571 548 722
Developing Markets 491 416 400
General corporate expenses (206) (189) (194)
Amortization of intangibles (13) (7) (10)
Operating income 4,331 4,521 4,749
Interest and other debt expense, net (604) (510) (636)
Earnings from continuing
operations before income taxes $ 3,727 $ 4,011 $ 4,113
Our largest customer, Wal-Mart Stores, Inc. and its affiliates, accounted for approximately 15% of consolidated net revenues in 2007, 15% in 2006 and 14% in
2005. These net revenues occurred primarily in the U.S. across all segments.
78
Source: KRAFT FOODS INC, 10-K, February 25, 2008 Powered by Morningstar® Document Research℠