JetBlue Airlines 2005 Annual Report Download - page 65
Download and view the complete annual report
Please find page 65 of the 2005 JetBlue Airlines annual report below. You can navigate through the pages in the report by either clicking on the pages listed below, or by using the keyword search tool below to find specific information within the annual report.-
 1
1 -
2
-
3
-
4
-
5
-
6
-
7
-
8
-
9
-
10
-
11
-
12
-
13
-
14
-
15
-
16
-
17
-
18
-
19
-
20
-
21
-
22
-
23
-
24
-
25
-
26
-
27
-
28
-
29
-
30
-
31
-
32
-
33
-
34
-
35
-
36
-
37
-
38
-
39
-
40
-
41
-
42
-
43
-
44
-
45
-
46
-
47
-
48
-
49
-
50
-
51
-
52
-
53
-
54
-
 55
55 -
 56
56 -
 57
57 -
 58
58 -
 59
59 -
 60
60 -
 61
61 -
 62
62 -
 63
63 -
 64
64 -
 65
65 -
 66
66 -
 67
67 -
 68
68 -
 69
69 -
 70
70 -
 71
71 -
 72
72 -
 73
73 -
 74
74 -
 75
75 -
76
-
77
-
78
-
79
-
80
-
81
-
82
-
83
-
84
-
85
-
86
-
87
-
88
-
89
-
90
-
91
-
92
-
93
-
94
-
95
-
96
-
97
-
98
-
99
-
100
 |
 |

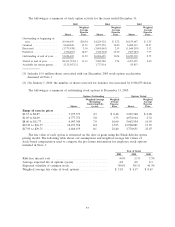
The following is a summary of stock option activity for the years ended December 31:
2005 2004 2003
Shares
Weighted
Average
Exercise
Price Shares
Weighted
Average
Exercise
Price Shares
Weighted
Average
Exercise
Price
Outstanding at beginning of
year ................... 26,966,499 $10.54 24,229,518 $ 8.72 20,159,447 $ 5.25
Granted ................. 6,600,006 13.53 4,957,950 16.90 6,082,313 18.47
Exercised ................ (1,779,598) 3.16 (1,695,065) 2.59 (1,644,299) 2.52
Forfeited ................. (700,485) 14.07 (525,904) 12.30 (367,943) 7.77
Outstanding at end of year. . . 31,086,422 11.52 26,966,499 10.54 24,229,518 8.72
Vested at end of year ....... 28,411,718 (1) 11.13 5,962,386 5.74 4,457,455 2.60
Available for future grants . . . 2,132,587 (2) 1,777,914 85,813
(1) Includes 19.9 million shares associated with our December 2005 stock option acceleration
discussed in Note 1.
(2) On January 1, 2006, the number of shares reserved for issuance was increased by 6,904,879 shares.
The following is a summary of outstanding stock options at December 31, 2005:
Options Outstanding Options Vested
Shares
Weighted-Average
Remaining
Contractual Life
(years)
Weighted
Average
Exercise
Price Shares
Weighted
Average
Exercise
Price
Range of exercise prices
$0.33 to $0.87 ............... 3,275,573 4.3 $ 0.48 3,269,348 $ 0.48
$1.05 to $4.00 ............... 4,777,752 5.8 2.33 4,670,104 2.32
$8.00 to $11.73 .............. 4,093,344 7.0 10.60 3,602,954 10.59
$12.29 to $16.37 ............. 14,473,594 8.4 13.95 13,098,681 13.93
$17.93 to $29.71 ............. 4,466,159 8.1 22.40 3,770,631 22.07
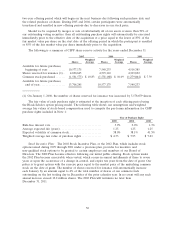
The fair value of each option is estimated on the date of grant using the Black-Scholes option
pricing model. The following table shows our assumptions and weighted average fair values of
stock-based compensation used to compute the pro forma information for employee stock options
included in Note 1:
Year of Grant
2005 2004 2003
Risk-free interest rate......................................... 4.0%3.1%3.5%
Average expected life of options (years) ........................ 4.8 4.6 6.3
Expected volatility of common stock............................ 38.0%38.1%41.5%
Weighted average fair value of stock options .................... $ 5.18 $ 6.17 $ 8.63
57