JetBlue Airlines 2005 Annual Report Download - page 15
Download and view the complete annual report
Please find page 15 of the 2005 JetBlue Airlines annual report below. You can navigate through the pages in the report by either clicking on the pages listed below, or by using the keyword search tool below to find specific information within the annual report.-
 1
1 -
2
-
3
-
4
-
 5
5 -
 6
6 -
 7
7 -
 8
8 -
 9
9 -
 10
10 -
 11
11 -
 12
12 -
 13
13 -
 14
14 -
 15
15 -
 16
16 -
 17
17 -
 18
18 -
 19
19 -
 20
20 -
 21
21 -
 22
22 -
 23
23 -
 24
24 -
 25
25 -
26
-
27
-
28
-
29
-
30
-
31
-
32
-
33
-
34
-
35
-
36
-
37
-
38
-
39
-
40
-
41
-
42
-
43
-
44
-
45
-
46
-
47
-
48
-
49
-
50
-
51
-
52
-
53
-
54
-
55
-
56
-
57
-
58
-
59
-
60
-
61
-
62
-
63
-
64
-
65
-
66
-
67
-
68
-
69
-
70
-
71
-
72
-
73
-
74
-
75
-
76
-
77
-
78
-
79
-
80
-
81
-
82
-
83
-
84
-
85
-
86
-
87
-
88
-
89
-
90
-
91
-
92
-
93
-
94
-
95
-
96
-
97
-
98
-
99
-
100
 |
 |

high fuel prices, has adversely impacted our operating results. In an effort to become profitable, other
major airlines have shifted some of their domestic capacity to their international routes, where they
are better able to include fuel surcharges in their fares. As our route structure is primarily domestic
U.S., we have been unable to recover all of the increased cost of fuel in our ticket prices. We
anticipate the extremely competitive nature of the industry to continue.
Airlines also frequently participate in marketing alliances, which generally provide for
code-sharing, frequent flyer program reciprocity, coordinated flight schedules that provide for
convenient connections and other joint marketing activities. These alliances also permit an airline to
market flights operated by other alliance airlines as its own. The benefits of broad networks offered to
customers could attract more customers to these networks. We do not currently participate in any
marketing alliances, interline or offer joint fares with other airlines, nor do we have any commuter
feeder relationships.
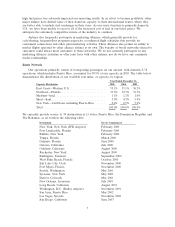
Route Network
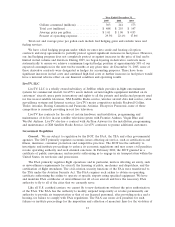
Our operations primarily consist of transporting passengers on our aircraft, with domestic U.S.
operations, which includes Puerto Rico, accounted for 98.5%of our capacity in 2005. The table below
demonstrates the distribution of our available seat miles, or capacity, by region:
Year Ended December 31,
Capacity Distribution 2005 2004 2003
East Coast—Western U.S. ......................... 55.1%55.1%56.2%
Northeast—Florida ............................... 33.5%32.7%31.7%
Medium—haul ................................... 1.1%1.2%1.0%
Short—haul ..................................... 3.9%4.5%5.9%
New York—Caribbean, including Puerto Rico ....... 6.4%6.5%5.2%
Total ........................................... 100.0%100.0%100.0%
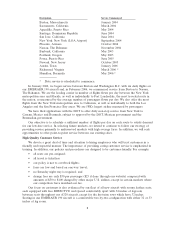
We currently provide service to 34 destinations in 15 states, Puerto Rico, the Dominican Republic and
The Bahamas, as set forth in the following table:
Destination Service Commenced
New York, New York (JFK Airport) February 2000
Fort Lauderdale, Florida February 2000
Buffalo, New York February 2000
Tampa, Florida March 2000
Orlando, Florida June 2000
Ontario, California July 2000
Oakland, California August 2000
Rochester, New York August 2000
Burlington, Vermont September 2000
West Palm Beach, Florida October 2000
Salt Lake City, Utah November 2000
Fort Myers, Florida November 2000
Seattle, Washington May 2001
Syracuse, New York May 2001
Denver, Colorado May 2001
New Orleans, Louisiana July 2001
Long Beach, California August 2001
Washington, D.C. (Dulles Airport) November 2001
San Juan, Puerto Rico May 2002
Las Vegas, Nevada November 2002
San Diego, California June 2003
7