JetBlue Airlines 2005 Annual Report Download - page 40
Download and view the complete annual report
Please find page 40 of the 2005 JetBlue Airlines annual report below. You can navigate through the pages in the report by either clicking on the pages listed below, or by using the keyword search tool below to find specific information within the annual report.-
 1
1 -
2
-
3
-
4
-
5
-
6
-
7
-
8
-
9
-
10
-
11
-
12
-
13
-
14
-
15
-
16
-
17
-
18
-
19
-
20
-
21
-
22
-
23
-
24
-
25
-
26
-
27
-
28
-
29
-
 30
30 -
 31
31 -
 32
32 -
 33
33 -
 34
34 -
 35
35 -
 36
36 -
 37
37 -
 38
38 -
 39
39 -
 40
40 -
 41
41 -
 42
42 -
 43
43 -
 44
44 -
 45
45 -
 46
46 -
 47
47 -
 48
48 -
 49
49 -
 50
50 -
51
-
52
-
53
-
54
-
55
-
56
-
57
-
58
-
59
-
60
-
61
-
62
-
63
-
64
-
65
-
66
-
67
-
68
-
69
-
70
-
71
-
72
-
73
-
74
-
75
-
76
-
77
-
78
-
79
-
80
-
81
-
82
-
83
-
84
-
85
-
86
-
87
-
88
-
89
-
90
-
91
-
92
-
93
-
94
-
95
-
96
-
97
-
98
-
99
-
100
 |
 |

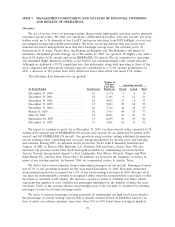
competition and continued increases in industry capacity. We have encountered aggressive responses
from our competitors trying to protect or regain market share through fare matching, price discounts,
targeted sale promotions and frequent flyer travel initiatives, all of which are usually matched by other
airlines. The second factor is the record high aircraft fuel prices caused by the sharp rise in crude oil
prices. Hurricanes Katrina and Rita disrupted a significant portion of the oil production and refining
operations in and around the Gulf of Mexico, resulting in unprecedented high fuel prices. The
competitive industry environment, record high fuel prices and increased capacity on the routes we fly,
including capacity that was added by us, have all affected our ability to increase fares. As a result, we
experienced a significant reduction in our profitability in 2005.
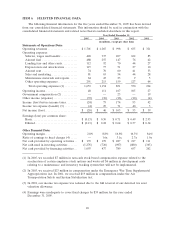
Year 2005 Compared to Year 2004
We had a net loss of $20 million for the year 2005 compared to net income of $46 million for the
year 2004. We had operating income of $48 million, a decrease of $63 million over 2004, and our
operating margin was 2.8%, down 6.0 points from 2004. Diluted loss per share was $0.13 for 2005 and
diluted earnings per share was $0.28 for 2004.
Operating Revenues. Operating revenues increased 34.5%, or $436 million, primarily due to an
increase in passenger revenues. Increased passengers resulting from a 23.7%increase in departures, or
$345 million, and a 3.5%increase in yields, or $55 million, drove the increase in passenger revenue of
$400 million for the year 2005. Additionally, three major hurricanes during the third and fourth
quarters resulted in estimated lost revenue of $8 to $10 million. Other revenue increased 78.4%,or
$36 million, primarily due to increased LiveTV third party revenues of $13 million, increased change
fees of $6 million resulting from more passengers and the marketing component of TrueBlue point
sales of $7 million.
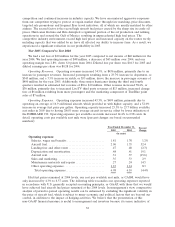
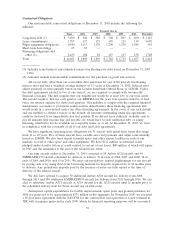
Operating Expenses. Operating expenses increased 43.3%, or $499 million, primarily due to
operating an average of 16.9 additional aircraft, which provided us with higher capacity, and a 52.0%
increase in average fuel price per gallon. Operating capacity increased 25.3%to 23.7 billion available
seat miles in 2005 due to having 28.0%more average aircraft in-service offset by lower utilization of
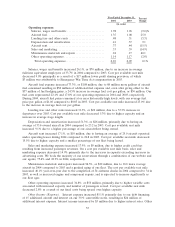
the EMBRAER 190. Operating expenses per available seat mile increased 14.4%to 6.98 cents. In
detail, operating costs per available seat mile were (percent changes are based on unrounded
numbers):
Year Ended December 31, Percent
Change2005 2004
(in cents)
Operating expenses:
Salaries, wages and benefits .......................... 1.81 1.78 1.2%
Aircraft fuel ........................................ 2.06 1.35 52.4
Landing fees and other rents ......................... .47 .48 (2.3)
Depreciation and amortization........................ .48 .41 19.1
Aircraft rent........................................ .31 .37 (15.6)
Sales and marketing ................................. .35 .33 2.9
Maintenance materials and repairs .................... .27 .24 14.5
Other operating expenses ............................ 1.23 1.14 8.3
Total operating expenses ........................... 6.98 6.10 14.4%
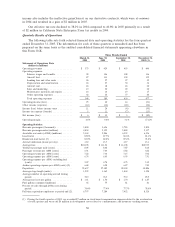
Had fuel prices remained at 2004 levels, our cost per available seat mile, or CASM, would have
only increased by 4.3%to 6.37 cents. The following table reconciles our operating expenses reported
in accordance with U.S. generally accepted accounting principles, or GAAP, with those that we would
have achieved had aircraft fuel prices remained at the 2004 levels. In management’s view, comparative
analysis of period-to-period operating results can be enhanced by excluding the significant volatility in
the price of aircraft fuel, which is subject to many economic and political factors that are beyond our
control, in addition to the impact of hedging activities. We believe that the presentation of this
non-GAAP financial measure is useful to management and investors because it is more indicative of
32