JetBlue Airlines 2005 Annual Report Download - page 42
Download and view the complete annual report
Please find page 42 of the 2005 JetBlue Airlines annual report below. You can navigate through the pages in the report by either clicking on the pages listed below, or by using the keyword search tool below to find specific information within the annual report.-
 1
1 -
2
-
3
-
4
-
5
-
6
-
7
-
8
-
9
-
10
-
11
-
12
-
13
-
14
-
15
-
16
-
17
-
18
-
19
-
20
-
21
-
22
-
23
-
24
-
25
-
26
-
27
-
28
-
29
-
30
-
31
-
 32
32 -
 33
33 -
 34
34 -
 35
35 -
 36
36 -
 37
37 -
 38
38 -
 39
39 -
 40
40 -
 41
41 -
 42
42 -
 43
43 -
 44
44 -
 45
45 -
 46
46 -
 47
47 -
 48
48 -
 49
49 -
 50
50 -
 51
51 -
 52
52 -
53
-
54
-
55
-
56
-
57
-
58
-
59
-
60
-
61
-
62
-
63
-
64
-
65
-
66
-
67
-
68
-
69
-
70
-
71
-
72
-
73
-
74
-
75
-
76
-
77
-
78
-
79
-
80
-
81
-
82
-
83
-
84
-
85
-
86
-
87
-
88
-
89
-
90
-
91
-
92
-
93
-
94
-
95
-
96
-
97
-
98
-
99
-
100
 |
 |
increased 14.5%year-over-year due to the completion of 63 airframe checks in 2005 compared to 54 in
2004, as well as increased engine and component repairs, and is expected to increase significantly as
our fleet ages.
Effective July 1, 2005, we executed a ten-year engine services agreement with MTU covering the
scheduled and unscheduled repair of the engines on our Airbus A320 aircraft. This agreement
requires monthly payments to MTU at rates based on number of flight hours each engine was
operated during each month. MTU has assumed the responsibility to repair and overhaul our engines
as required during the term of the agreement. These payments will be expensed as the flight hours are
incurred. This agreement will eliminate the significant judgment in determining estimated costs of
overhauls and is expected to result in lower maintenance costs than on a time and materials basis.
Other operating expenses increased 35.8%, or $76 million, primarily due to higher variable costs
associated with increased capacity and number of passengers served. Cost per available seat mile
increased 8.3%as a result of increased LiveTV third party installations, fuel related taxes and services,
and a $6 million write-off of development costs related to a maintenance and inventory tracking
system that will not be implemented.
Other Income (Expense). Interest expense increased 99.2%primarily due to our debt financing
of 16 additional aircraft and interest on our $250 million of convertible debt issued in March 2005,
resulting in $35 million of additional interest expense, and higher interest rates, which resulted in
$19 million of additional interest expense. Interest income increased by $11 million due to higher
interest rates. Capitalized interest increased 79.3%, or $7 million, due to higher predelivery deposit
balances and increased rates.
Our effective tax rate decreased to 14.9%in 2005 from 38.2%in 2004. The effective tax rate
differs from the statutory income tax rate due to the nondeductibility of certain items for tax purposes
and the relationship of these items to our pre-tax loss of $24 million, which resulted primarily from
higher fuel prices.
Year 2004 Compared to Year 2003
Our net income for the year 2004 decreased to $46 million from $103 million for the year 2003.
We had operating income of $111 million, a decrease of $56 million over 2003, and our operating
margin was 8.8%, down 8.0 points from 2003.
Diluted earnings per share was $0.28 and $0.64 for the years ended 2004 and 2003, respectively.
Our results for 2003 included $23 million in Emergency War Time Act compensation which, net of
profit sharing and income taxes, amounted to $11 million, or $0.07 per diluted share.
Operating Revenues. Operating revenues increased 26.7%, or $267 million, primarily due to an
increase in passenger revenues. Increased passengers resulting from a 35.3%increase in departures, or
$352 million, partially offset by a 7.4%decrease in yield, or $97 million, drove the increase in
passenger revenue of $255 million for the year 2004. Lower yields experienced during 2004 and a
1.3 point reduction in load factor were primarily attributable to an extremely competitive
environment, which included unprecedented fare discounting and frequent flyer offers by several
airlines in most of the markets we serve. These carriers also added back capacity that was taken out in
2003 at the onset of hostilities in Iraq, which significantly impacted our East-West markets.
Additionally, four major hurricanes during the third quarter resulted in estimated lost revenue of $8 to
$10 million. Other revenue increased 35.9%, or $12 million, primarily due to increased change fees of
$6 million resulting from more passengers and LiveTV third party revenues of $3 million.
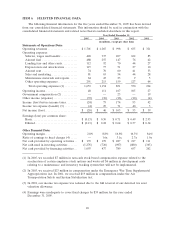
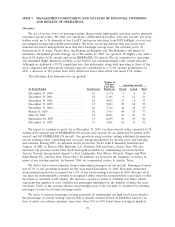
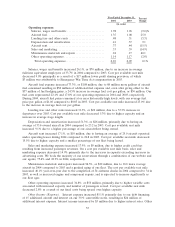
Operating Expenses. Operating expenses increased 38.8%, or $323 million, primarily due to
operating an average of 16.6 additional aircraft, which provided us with higher capacity. Operating
capacity increased 38.6%to 19 billion available seat miles due to scheduled capacity increases and
increased transcontinental flights over 2003. Operating expenses per available seat mile increased 0.1%
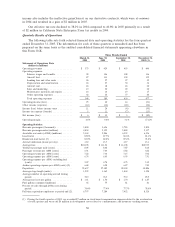
to 6.10 cents. In detail, operating costs per available seat mile were (percent changes are based on
unrounded numbers):
34